World indices overview: news from US 30, US 500, US Tech, JP 225, and DE 40 for 20 May 2025
All leading global stock indices have entered an uptrend. Find out more in our analysis and forecast for global indices for 20 May 2025.
US indices forecast: US 30, US 500, US Tech
- Recent data: the US PPI came in at 2.4% in April
- Market impact: this is a positive signal for the market, especially for rate-sensitive sectors (technology, real estate, and consumer sector)
Fundamental analysis
The Producer Price Index slowed from 2.7% to 2.4% year-on-year, with the core PPI down from 3.3% to 3.1%. This signals that inflationary pressures on the production stage continue to ease. Low or declining PPI readings increase expectations of monetary easing. If production inflation falls, the Federal Reserve will have more room for rate cuts without the risk of accelerating inflation.
Moody’s downgraded the US credit rating from AAA to AA1. Moody’s was the last of the major rating agencies to keep the US sovereign debt at the highest credit level. Now, by downgrading the rating, the 116-year-old agency has brought its assessment in line with its peers. Standard & Poor’s downgraded the US from AAA to AA+ in August 2011, while Fitch Ratings did the same in August 2023.
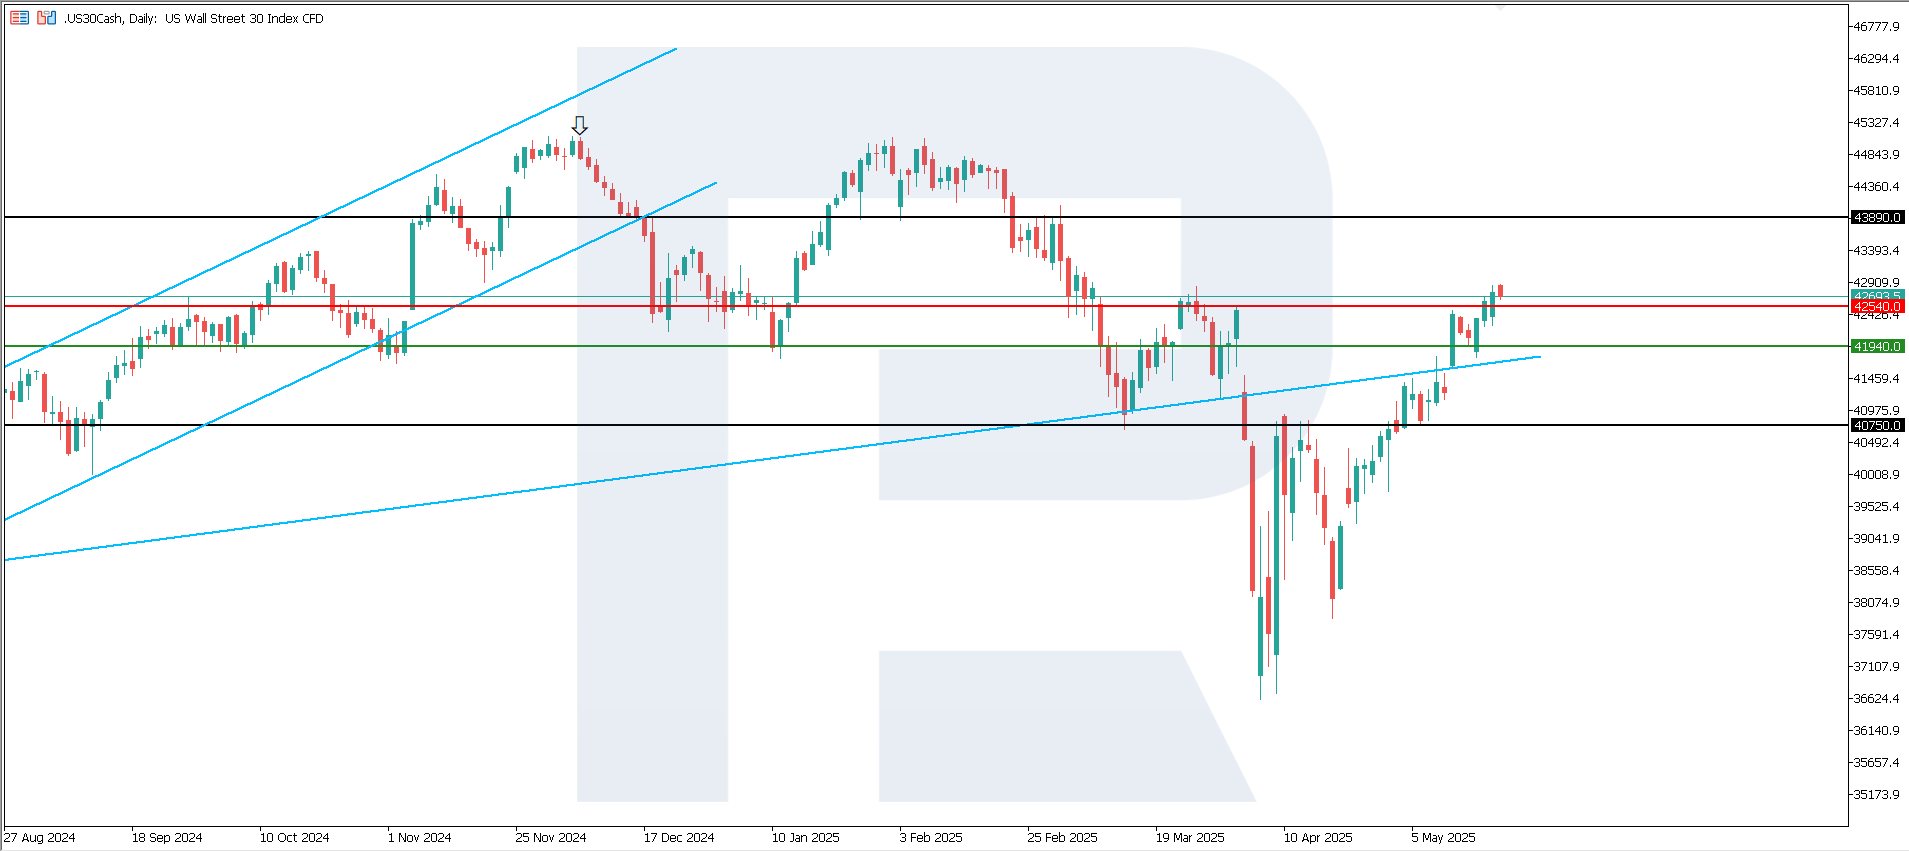
US 30 technical analysis
The US 30 index broke above the 42,535.0 resistance level, with support shifting from 37,060.0 to 41,940.0. A weak uptrend begins. The US 30 index fully recouped losses of early April 2025 and showed growth since the beginning of the year.
The following scenarios are considered for the US 30 price forecast:
- Pessimistic US 30 forecast: a breakout below the 41,940.0 support level could push the index down to 40,750.0
- Optimistic US 30 forecast: if the price consolidates above the previously breached resistance level at 42,535.0, the index could climb to 43,890.0
US 500 technical analysis
The US 500 index continues its ascent. The support level has shifted to 5,640.0, with resistance forming at 5,960.0. The price is likely to undergo a minor correction without a trend reversal and continue its upward trajectory. The current uptrend may become medium-term.
The following scenarios are considered for the US 500 price forecast:
- Pessimistic US 500 forecast: a breakout below the 5,640.0 support level could send the index down to 5,355.02
- Optimistic US 500 forecast: a breakout above the 5,960.0 resistance level could propel the index to 6,085.0

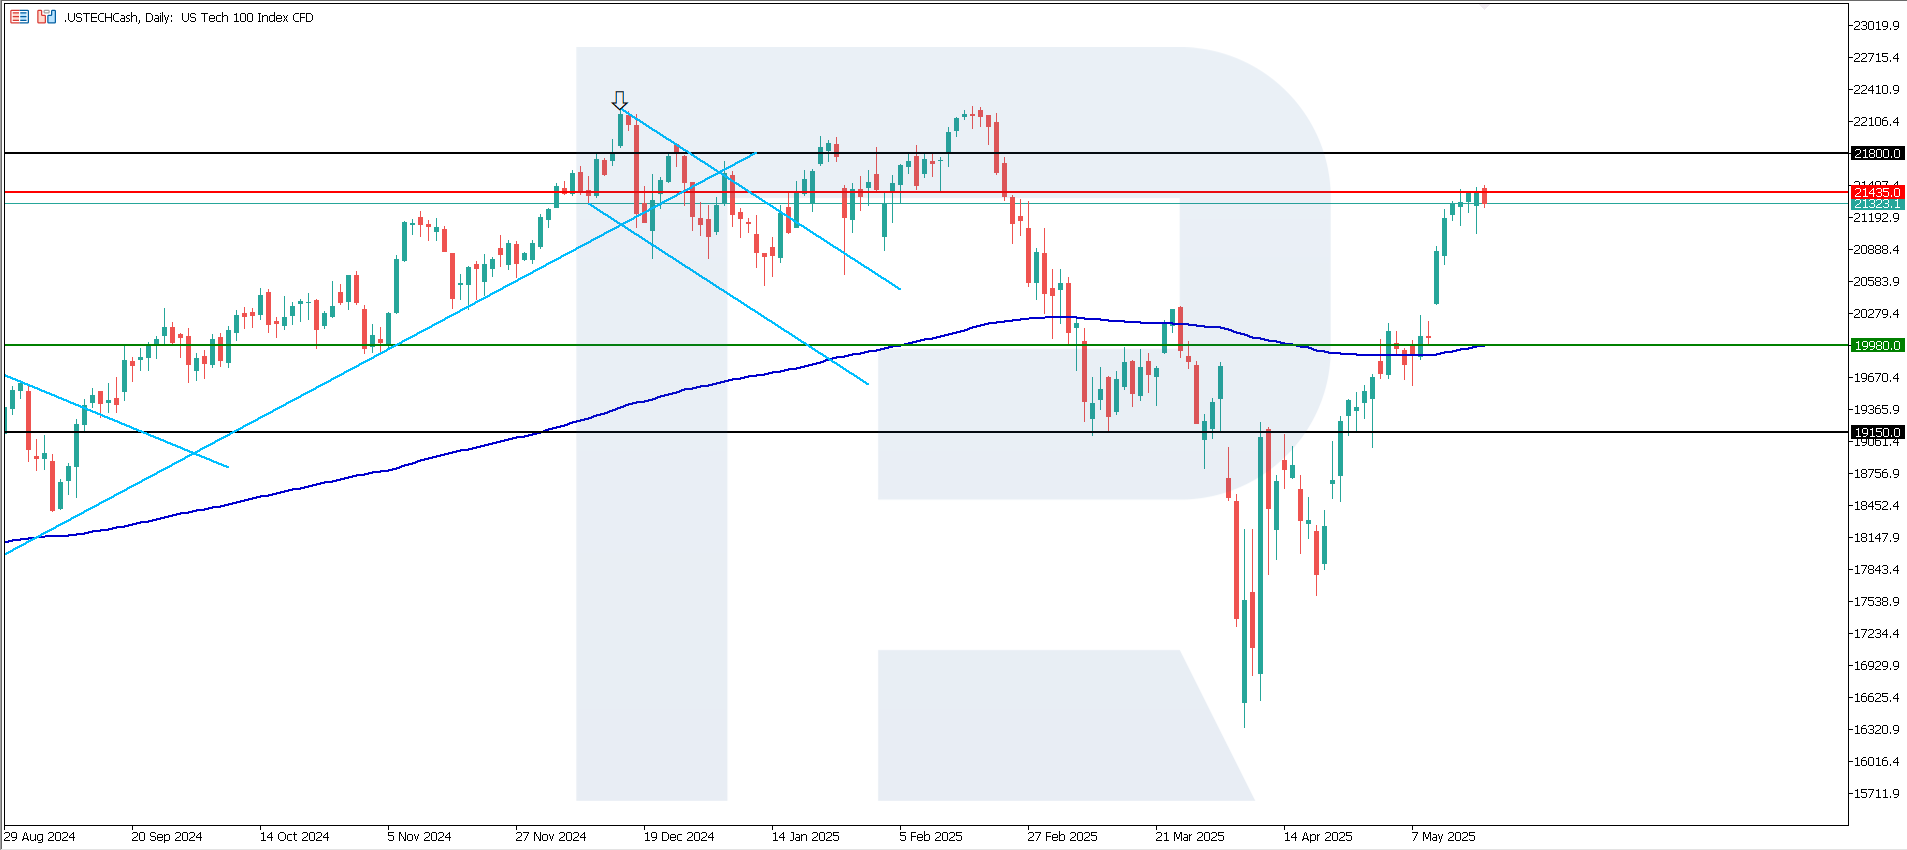
US Tech technical analysis
The US Tech index has formed a resistance level at 21,435.0, while the support line has moved to 19,980.0. The index is trading above the 200-day Moving Average, with the uptrend likely to become medium-term.
Scenarios for the US Tech index price forecast:
- Pessimistic US Tech forecast: a breakout below the 19,980.0 support level could push the index down to 19,150.0
- Optimistic US Tech forecast: a breakout above the 21,435.0 resistance level could boost the index to 21,800.0
Asian index forecast: JP 225
- Recent data: Japan’s GDP fell by 0.7% in April
- Market impact: the stock market could react with a decline, especially in export-oriented sectors
Fundamental analysis
The decrease in GDP signals slowing corporate earnings and a possible deterioration of the dividend and investment program outlook. Weak growth may increase pressure on the Bank of Japan to postpone or ease monetary tightening. Recession risks may cause capital reallocation to safe sectors such as telecommunications, utilities, and domestic consumption.
Foreign investors may temporarily reduce their exposure to the Japanese market due to a deteriorating macroeconomic background. The GDP report is negative for the stock market in the short term, especially for exporters, but may result in a softer Bank of Japan policy, partially offsetting the effect and even supporting the market in the medium term.
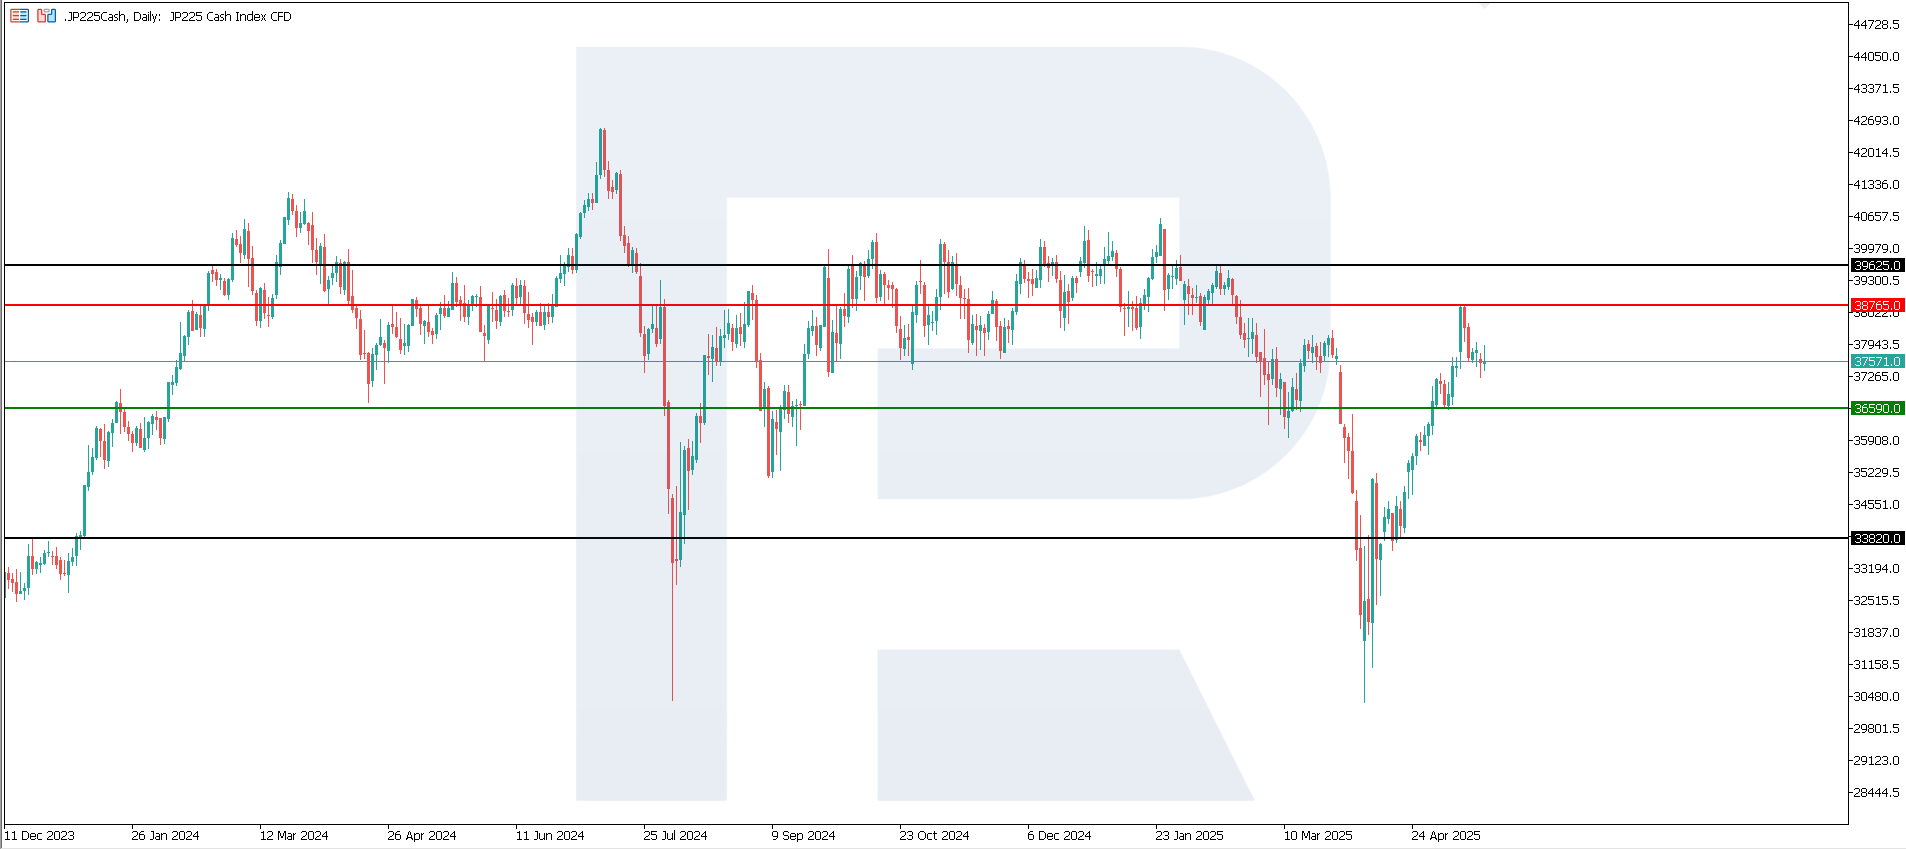
JP 225 technical analysis
The JP 225 index left a medium-term sideways range, breaking above the 38,130.0 resistance level. Despite the previously dominant downtrend, the current movement points to a potential change of direction. However, the risk of a false breakout remains. A new resistance level formed at 38,765.0, confirming the beginning of the uptrend.
The following scenarios are considered for the JP 225 price forecast:
- Pessimistic JP 225 forecast: a breakout below the 36,590.0 support level could push the index down to 33,820.0
- Optimistic JP 225 forecast: a breakout above the 38,765.0 resistance level could drive the index to 39,625.0
European index forecast: DE 40
- Recent data: Germany’s ZEW Indicator of Economic Sentiment was preliminarily +25.2 in May
- Market impact: improved business expectations and renewed optimism among experts give investors hope for growth in corporate profits
Fundamental analysis
Since the ZEW Index is considered a leading indicator, the growth of the index may boost optimism among private and institutional investors. Improved expectations are crucial for industrial and export-oriented companies, such as Siemens, Volkswagen, BASF, and BMW. These companies are sensitive to the economic cycle, with a positive outlook driving demand for their shares.
If market participants expected the indicator to improve, some of the positivity might have already been priced in. However, exceeding the forecast by more than two times may give an additional boost. The ZEW Indicator of Economic Sentiment heightens expectations of an economic recovery and may become a catalyst for short-term growth in the stock market, especially in the industrial, automotive, and banking sectors.
DE 40 technical analysis
The DE 40 stock index broke above the 23,925.0 resistance level and hit a new all-time high, with the support line shifting to 23,440.0. A new resistance level is yet to form. A new growth cycle could continue.
The following scenarios are considered for the DE 40 price forecast:
- Pessimistic DE 40 forecast: a breakout below the 23,440.0 support level could send the index down to 22,245.0
- Optimistic DE 40 forecast: if the price consolidates above the previously breached resistance level at 23,925.0, the index could rise to 24,345.0

Summary
All global stock indices now experience upward momentum. Even the US 30 was able to break above the resistance level and enter an uptrend. Moody’s decision to downgrade the US sovereign credit rating caused a brief correction in US indices. The German DE 40 hit a new all-time high and retains the potential for further growth.
Forecasts presented in this section only reflect the author’s private opinion and should not be considered as guidance for trading. RoboForex bears no responsibility for trading results based on trading recommendations described in these analytical reviews.