Daily technical analysis and forecast for 20 May 2025
Here is a detailed daily technical analysis and forecast for EURUSD, USDJPY, GBPUSD, AUDUSD, USDCAD, XAUUSD and Brent for 20 May 2025.
Table of Contents (H2)
EURUSD forecast
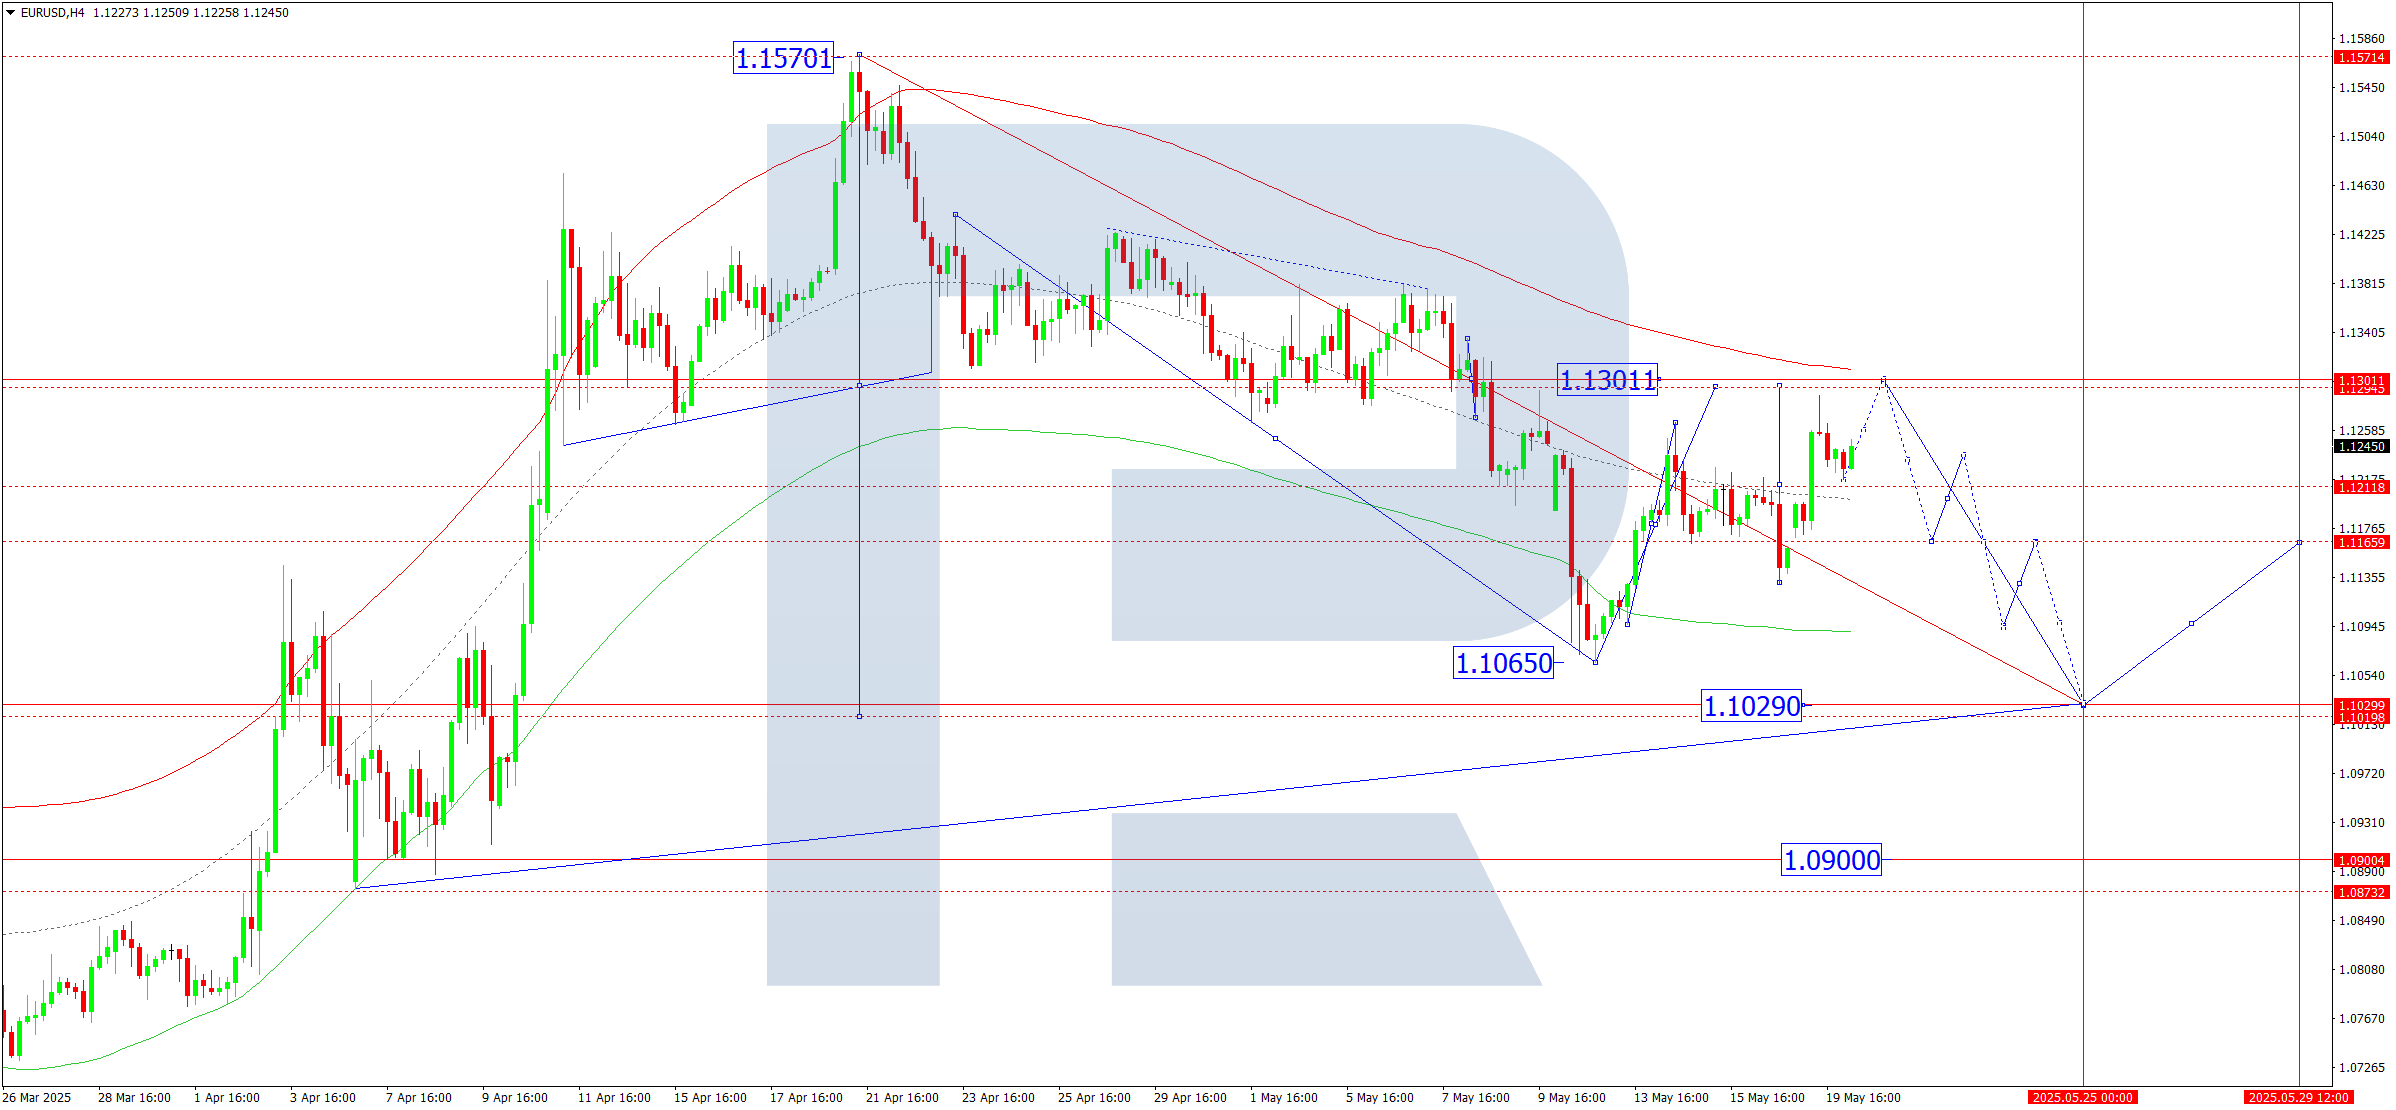
On the H4 chart of EURUSD, the market continues to form a consolidation range around 1.1212. Today, 20 May 2025, an upward expansion to 1.1300 (tested from below) is possible. Afterwards, a new downward wave towards the first target of 1.1029 may begin.
This scenario is technically supported by the Elliott wave structure and the downward wave matrix pivoting at 1.1300, considered key for the EURUSD wave structure. Currently, the correction is unfolding towards the upper boundary of the price Envelope at 1.1300. A further downward continuation to the lower boundary at 1.1029 is anticipated.
Technical indicators for today’s EURUSD forecast suggest viewing the current upward move as a correction towards 1.1300.
USDJPY forecast
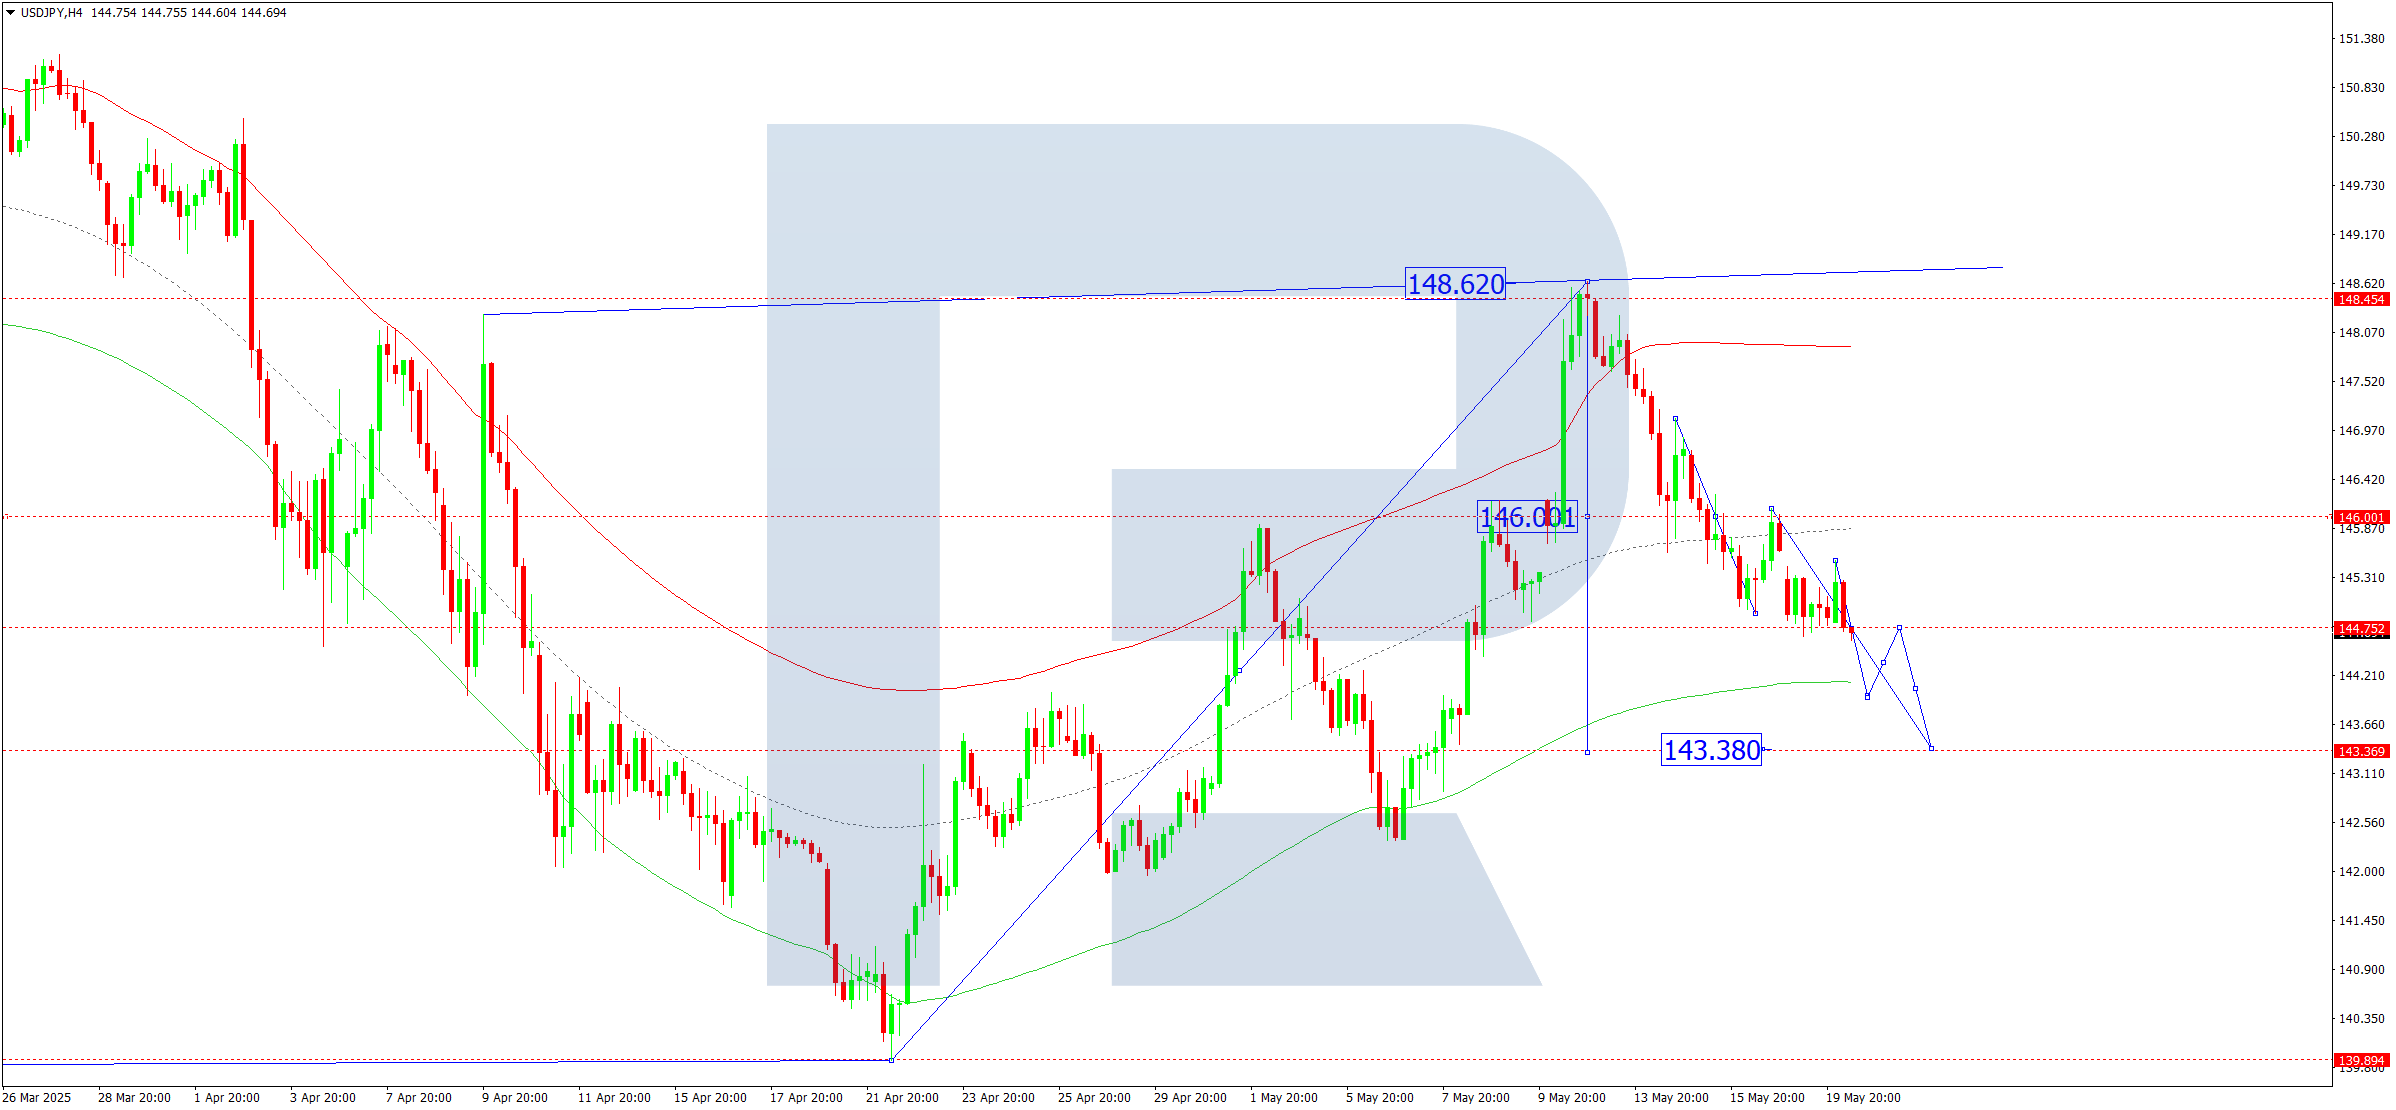
On the H4 chart of USDJPY, the market broke below the 144.75 level and continues to decline towards 143.38. Today, 20 May 2025, this target is likely to be reached. Afterwards, a new upward wave may begin towards 146.00, with the trend possibly extending to 148.60, the local target.
This scenario is confirmed by the Elliott wave structure and the upward wave matrix with a pivot at 143.38, regarded as key for the USDJPY structure. The market had previously completed the first upward wave to the upper boundary of the price Envelope at 148.64. A further correction towards its lower boundary at 143.38 is relevant, followed by a potential rise to 148.60.
Technical indicators for today’s USDJPY forecast suggest viewing the current decline as a correction towards 143.38.
GBPUSD forecast
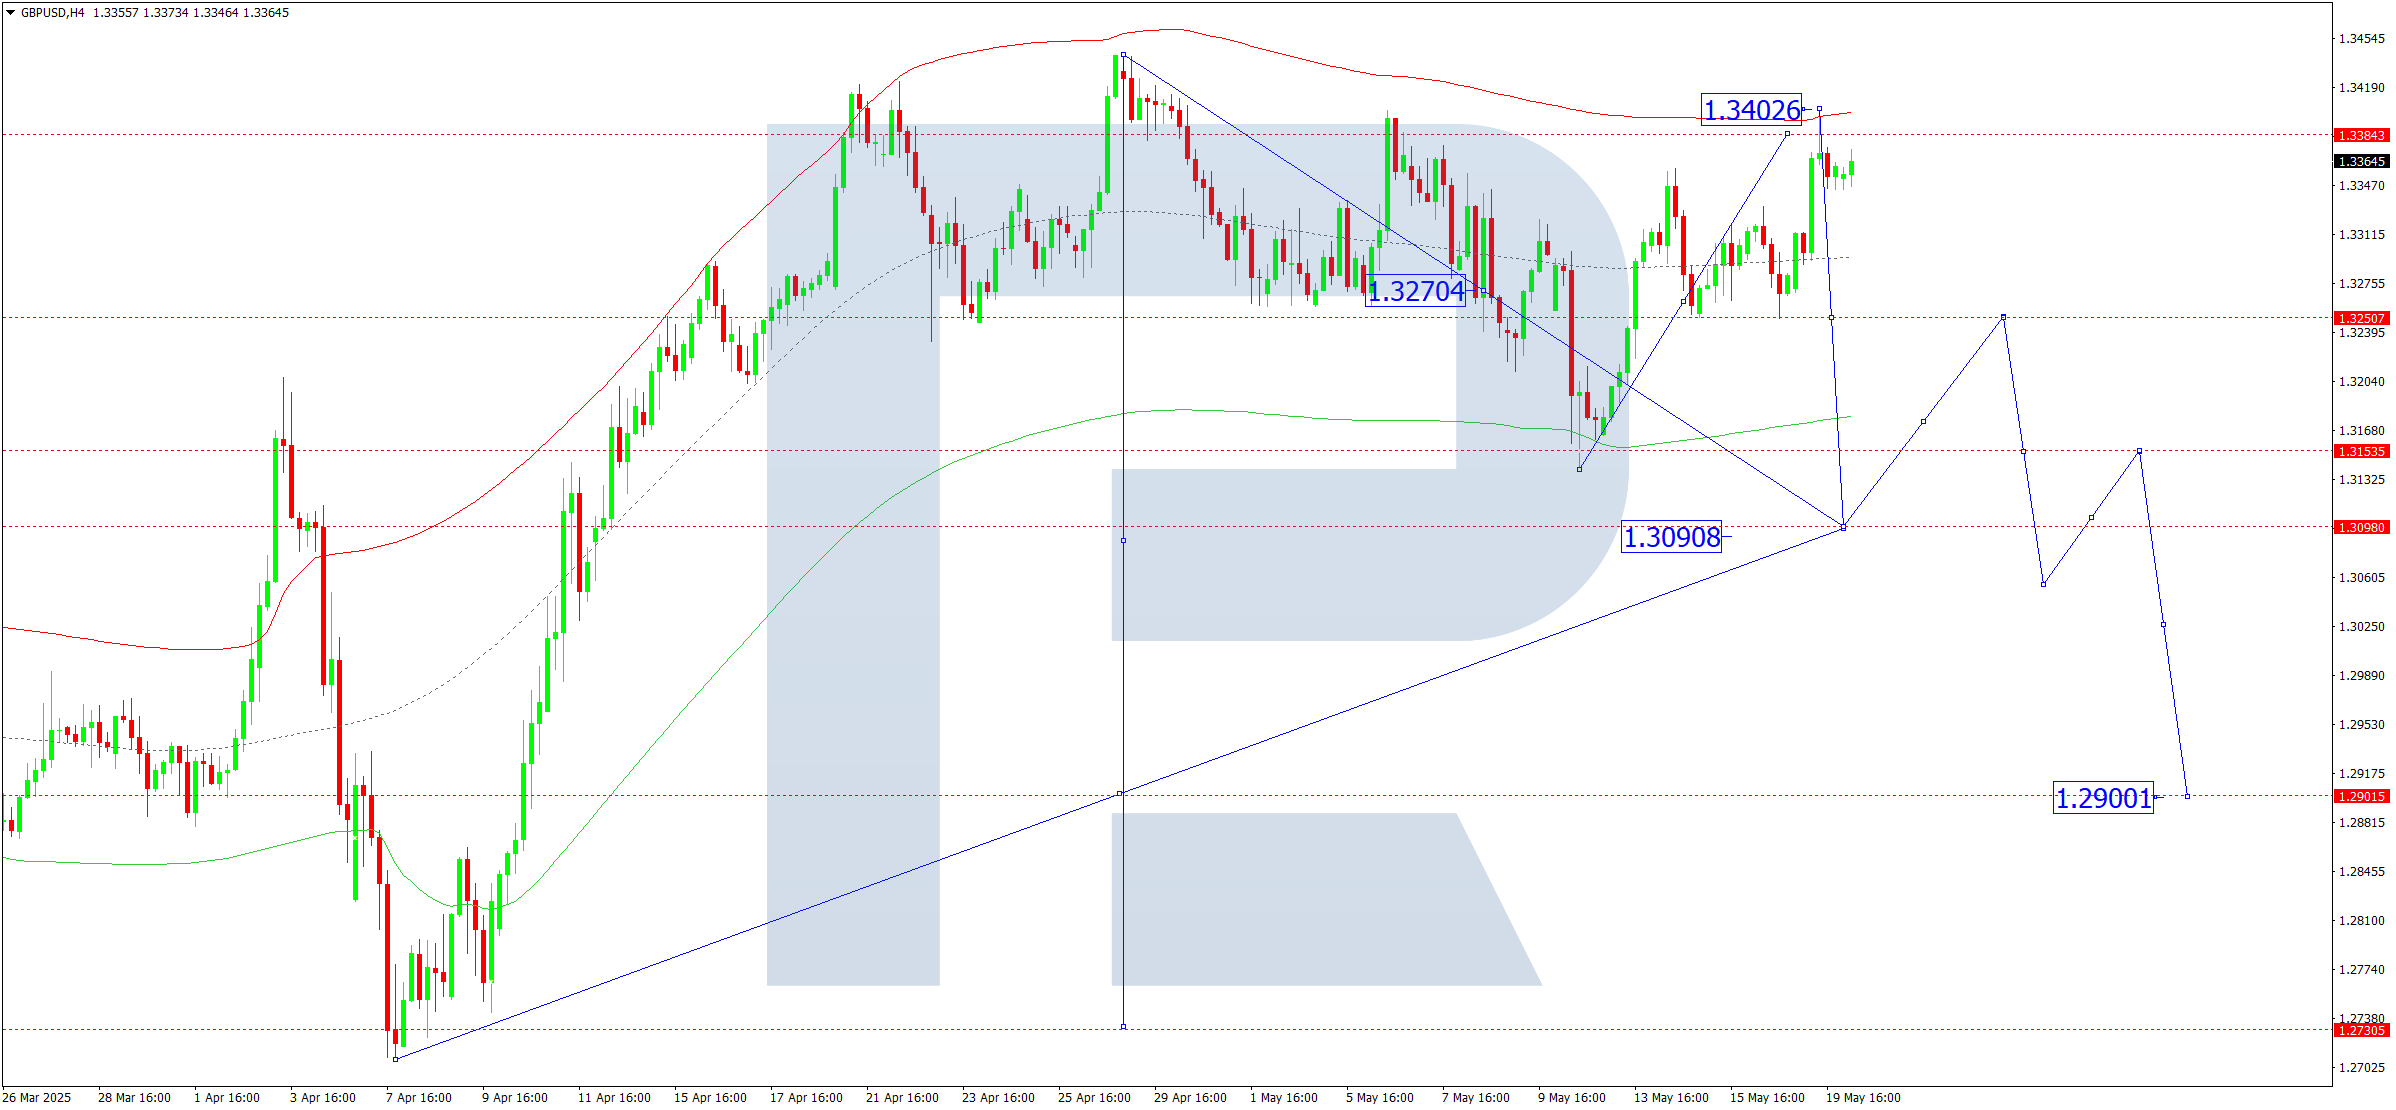
On the H4 chart of GBPUSD, the market extended the consolidation range to 1.3403. Today, 20 May 2025, a new consolidation range may form below this level. Then, a downward wave to 1.3270 is likely. A breakout below that level would open potential for a continuation to 1.3090, the first target.
This scenario is supported by the Elliott wave structure and the downward wave matrix with a pivot at 1.3270, viewed as key in the GBPUSD wave structure. The market has expanded the range to the upper boundary of the price Envelope at 1.3403. A downward wave towards the lower boundary at 1.3090 is relevant.
Technical indicators for today’s GBPUSD forecast suggest a downward wave may begin, targeting 1.3270 and 1.3090.
AUDUSD forecast
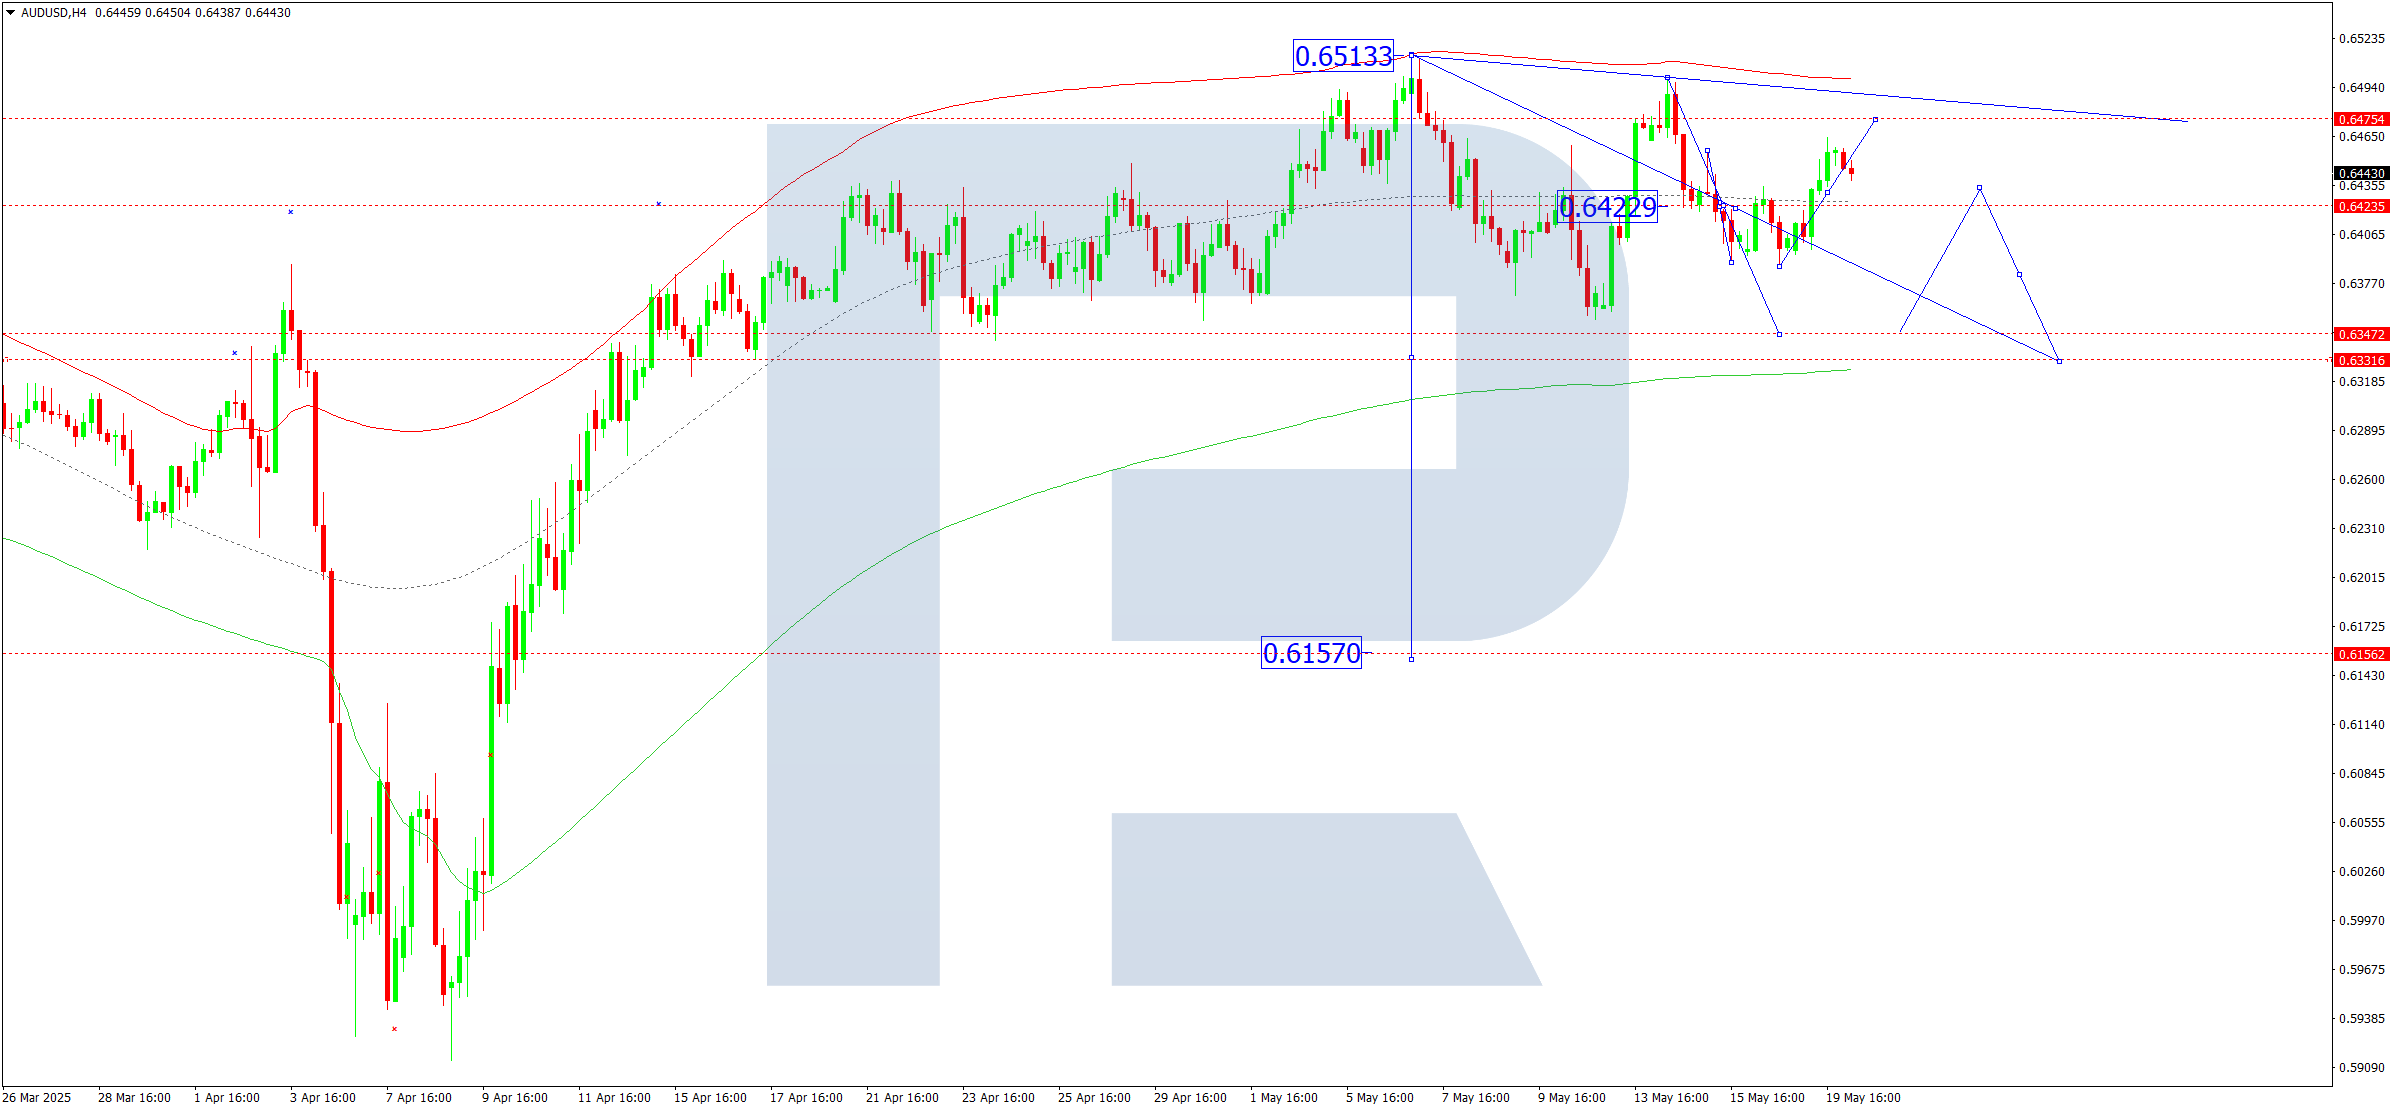
On the H4 chart of AUDUSD, the market is forming a wide consolidation structure around 0.6422, with no clear trend. Today, 20 May 2025, an upward expansion to 0.6475 is possible. Afterwards, a downward wave to 0.6333 may begin. This is the initial target.
This scenario is confirmed by the Elliott wave structure and the downward wave matrix with a pivot at 0.6422, viewed as key in the AUDUSD structure. Currently, the market is developing a wave to the lower boundary of the price Envelope at 0.6333. A rebound to the central line at 0.6422 remains possible.
Technical indicators for today’s AUDUSD forecast suggest a likely start of a downward wave towards 0.6333.
USDCAD forecast
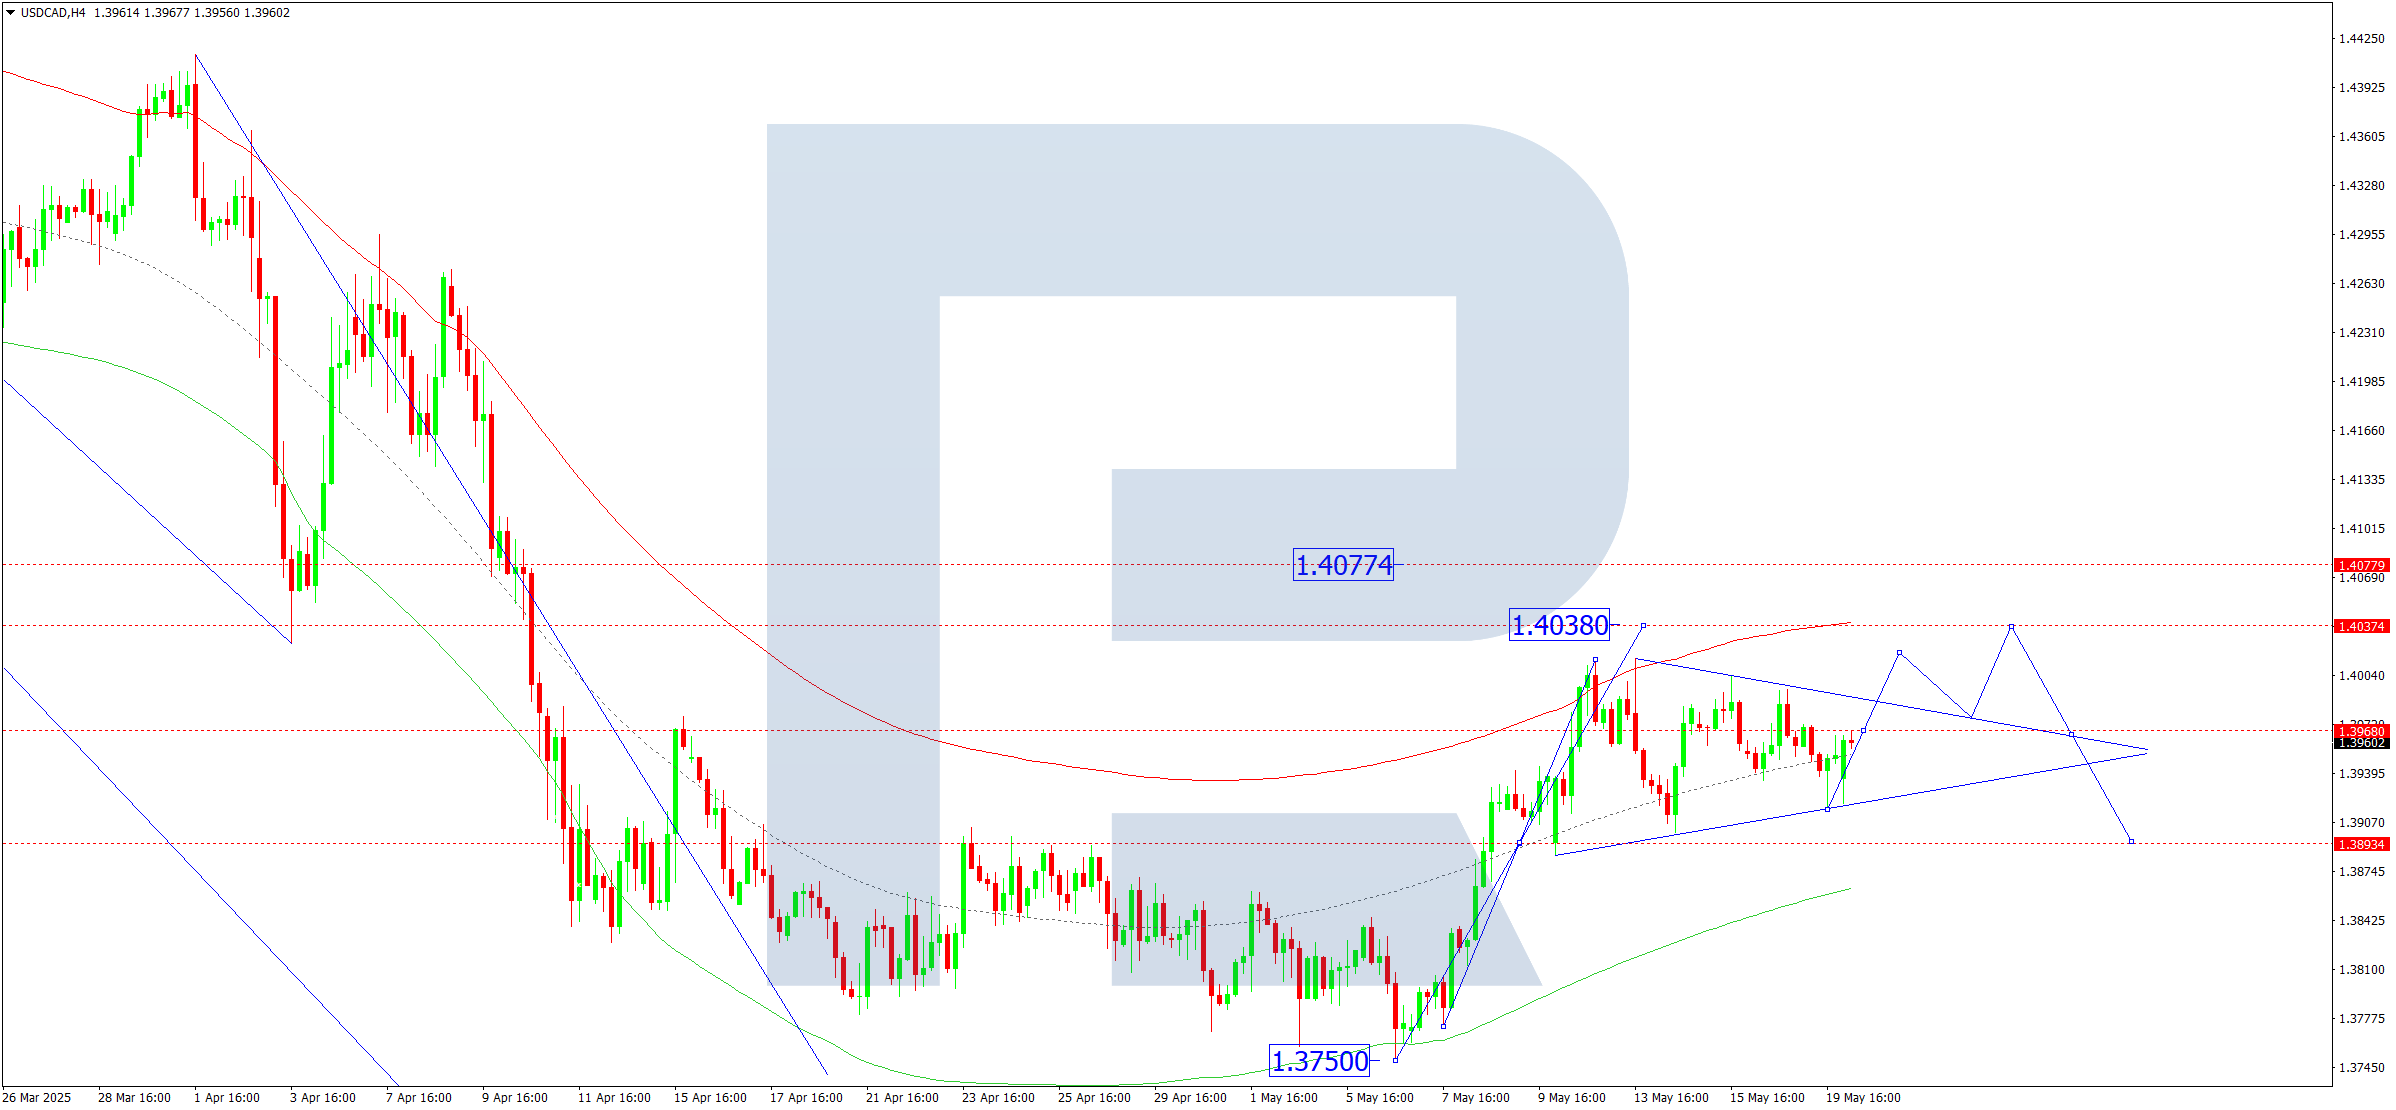
On the H4 chart of USDCAD, the market continues to develop a consolidation range around 1.3960, with no strong trend. Today, 20 May 2025, a decline to 1.3894 remains possible. Afterwards, a new upward wave to 1.4038 may begin, with potential continuation to 1.4077.
This scenario is technically confirmed by the Elliott wave structure and the upward wave matrix with a pivot at 1.3894, considered key for the USDCAD wave formation. The market previously rose to the upper boundary of the price Envelope at 1.4012 and corrected to the central line at 1.3894. Upon completion of this correction, an upward wave to the upper boundary at 1.4038 is likely.
Technical indicators for today’s USDCAD forecast suggest the beginning of an upward wave towards 1.4038.
XAUUSD forecast
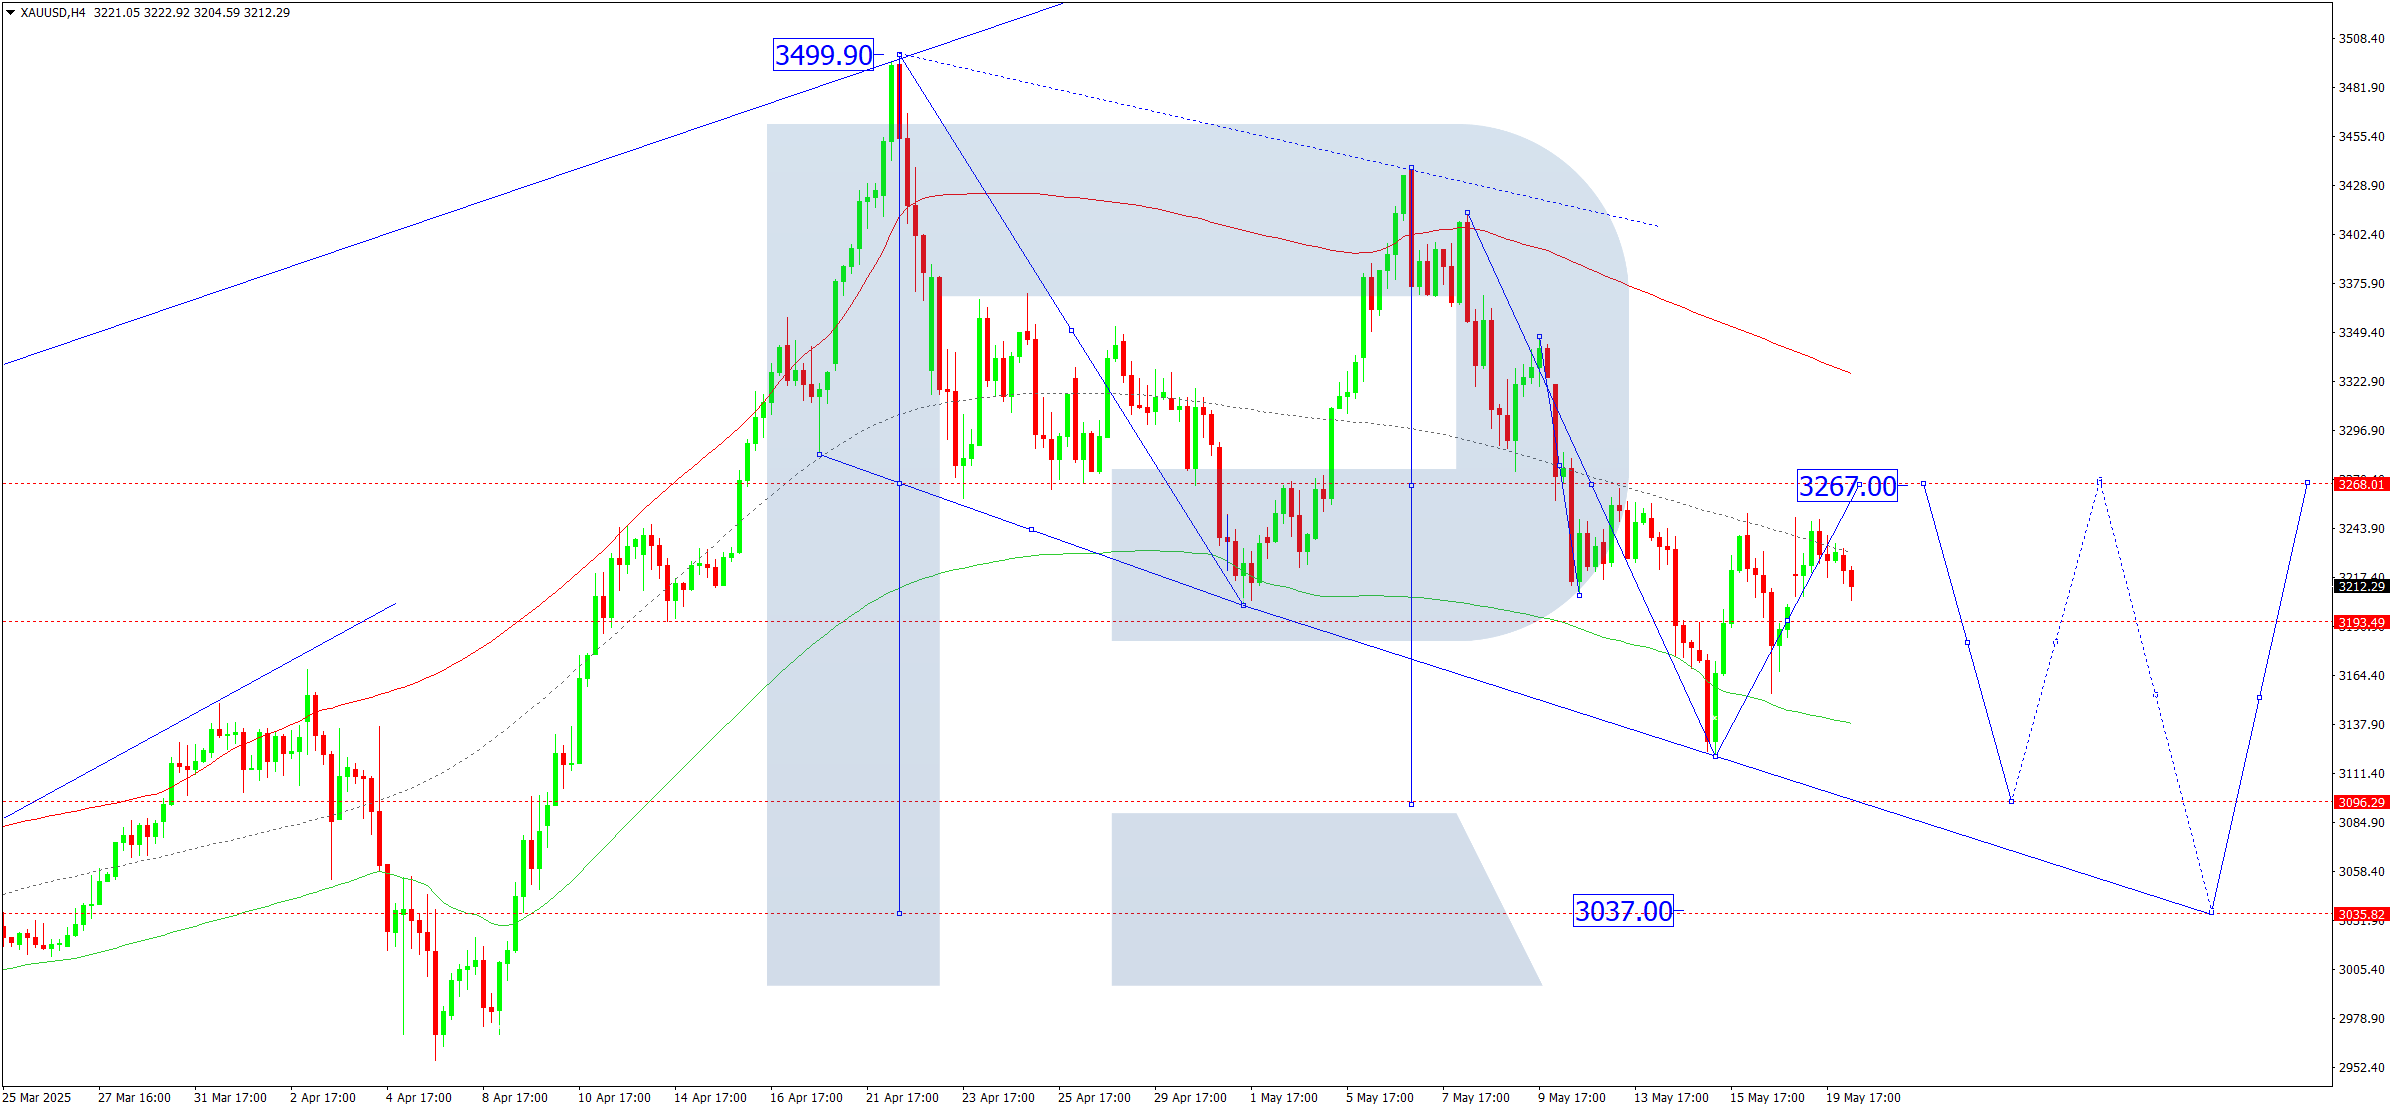
On the H4 chart of XAUUSD, the market continues to consolidate around 3,267. Today, 20 May 2025, an upward move to 3,267 (tested from below) is possible. Afterwards, a new downward wave to 3,100 is expected, with the trend possibly extending to 3,040, the first target.
This scenario is supported by the Elliott wave structure and the downward wave matrix with a pivot at 3,267, regarded as key in the current XAUUSD wave. At the moment, the correction is developing towards the central line of the price Envelope at 3,267. Then, a downward wave to the lower boundary at 3,100 is expected.
Technical indicators for today’s XAUUSD forecast point to the beginning of a downward wave towards 3,100.
Brent forecast
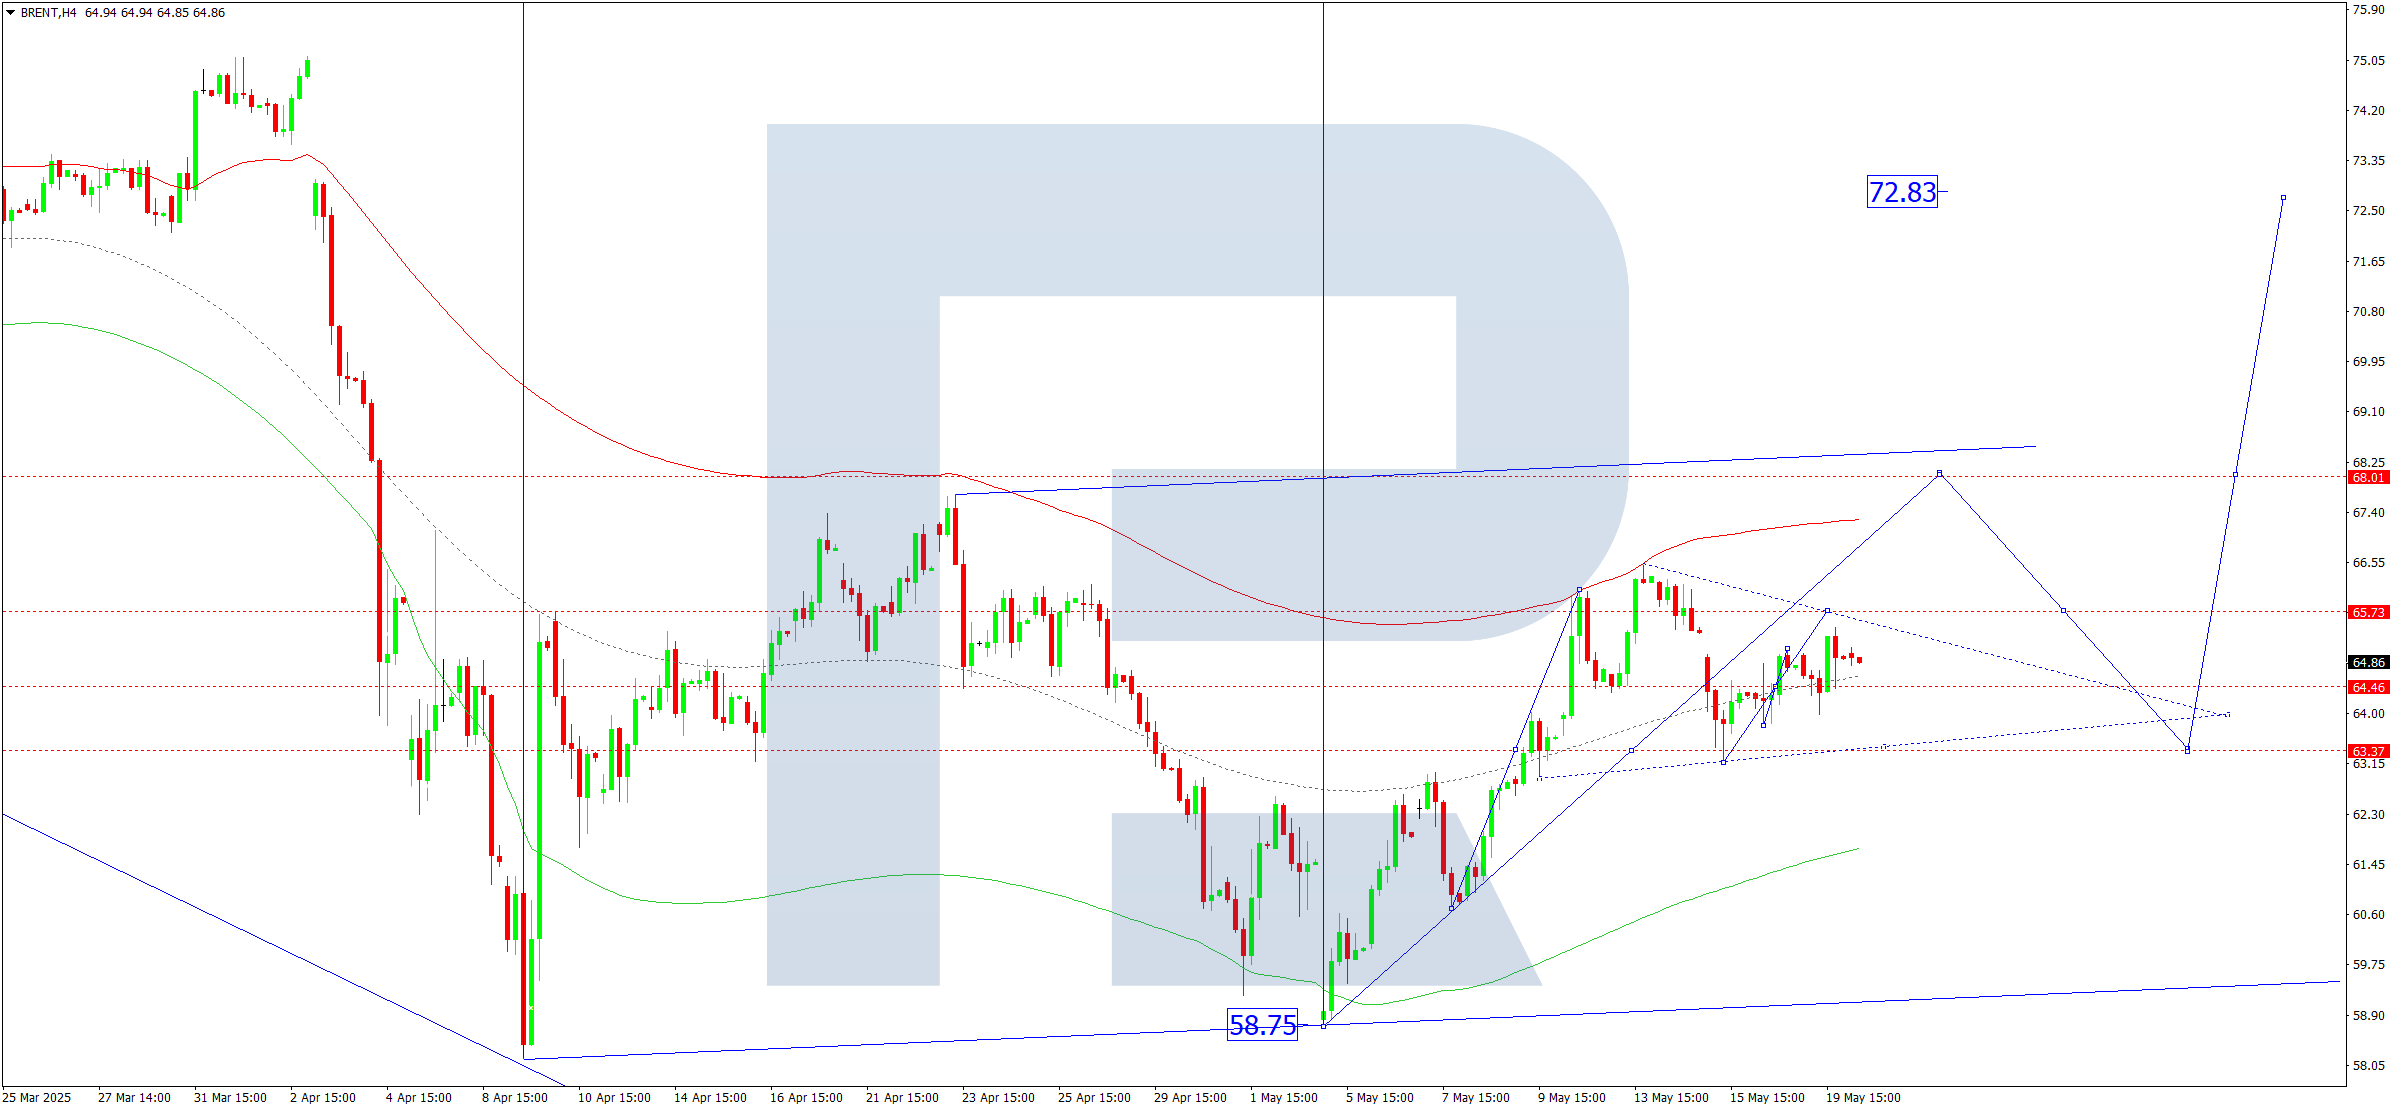
On the H4 chart of Brent crude, the market is forming a broad consolidation range around 63.33. Today, 20 May 2025, an expansion of the range upwards to 65.73 is possible. A breakout above this level would open potential for a continued wave towards 68.00, the first target.
This scenario is confirmed by the Elliott wave structure and the upward wave matrix with a pivot at 63.33, seen as key in the Brent structure. The market previously completed a correction to the central line of the price Envelope at 63.33. A wave towards the upper boundary at 68.00 is now relevant.
Technical indicators for today’s Brent forecast suggest a continued upward wave towards 68.00.
Forecasts presented in this section only reflect the author’s private opinion and should not be considered as guidance for trading. RoboForex bears no responsibility for trading results based on trading recommendations described in these analytical reviews.