Daily technical analysis and forecast for 19 May 2025
Here is a detailed daily technical analysis and forecast for EURUSD, USDJPY, GBPUSD, AUDUSD, USDCAD, XAUUSD and Brent for 19 May 2025.
Table of Contents (H2)
EURUSD forecast
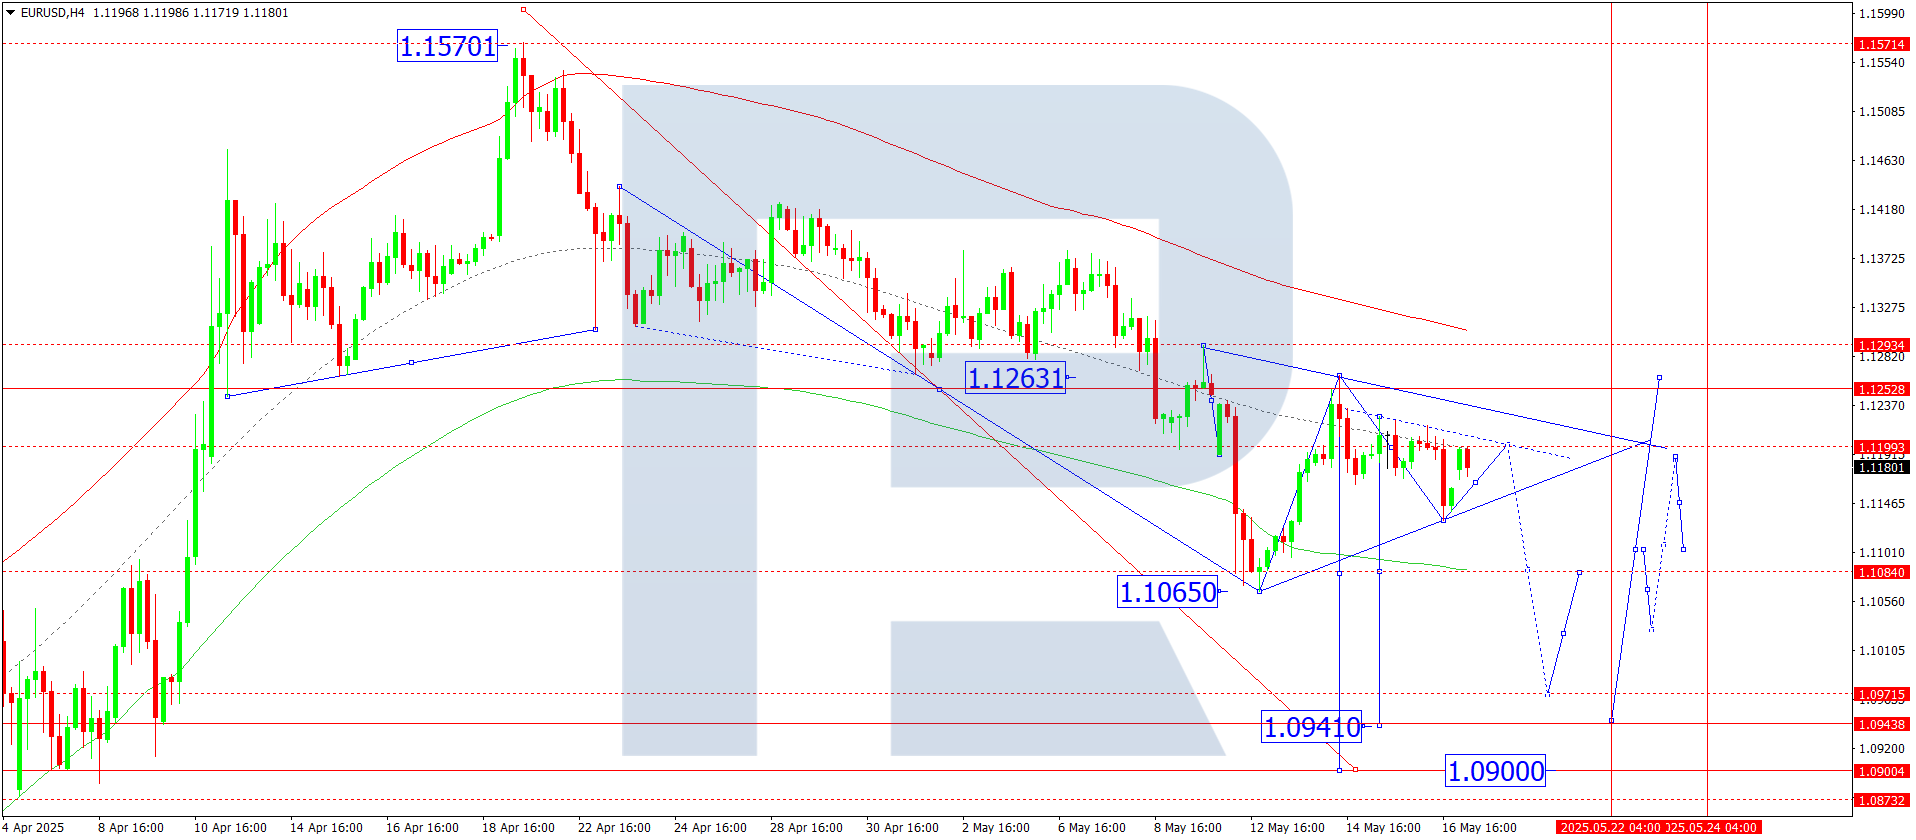
On the H4 chart of EURUSD, the market continues to develop a consolidation range around the 1.1200 level. Today, 19 May 2025, if the price breaks upwards, a continued correction to 1.1294 is possible. A downward breakout would likely lead to a wave towards 1.1080, with the trend possibly extending to 1.0970, the local target.
This scenario is supported technically by the Elliott wave structure and the downward wave matrix with a pivot at 1.1250, seen as key in the structure of this wave for EURUSD. At the moment, a wave is forming towards the lower boundary of the price Envelope at 1.1080. A subsequent upward correction to its central line at 1.1150 is possible, followed by a potential extension of the wave to its lower boundary at 1.0950 at minimum.
Technical indicators for today’s EURUSD forecast suggest a downward wave towards 1.1080.
USDJPY forecast
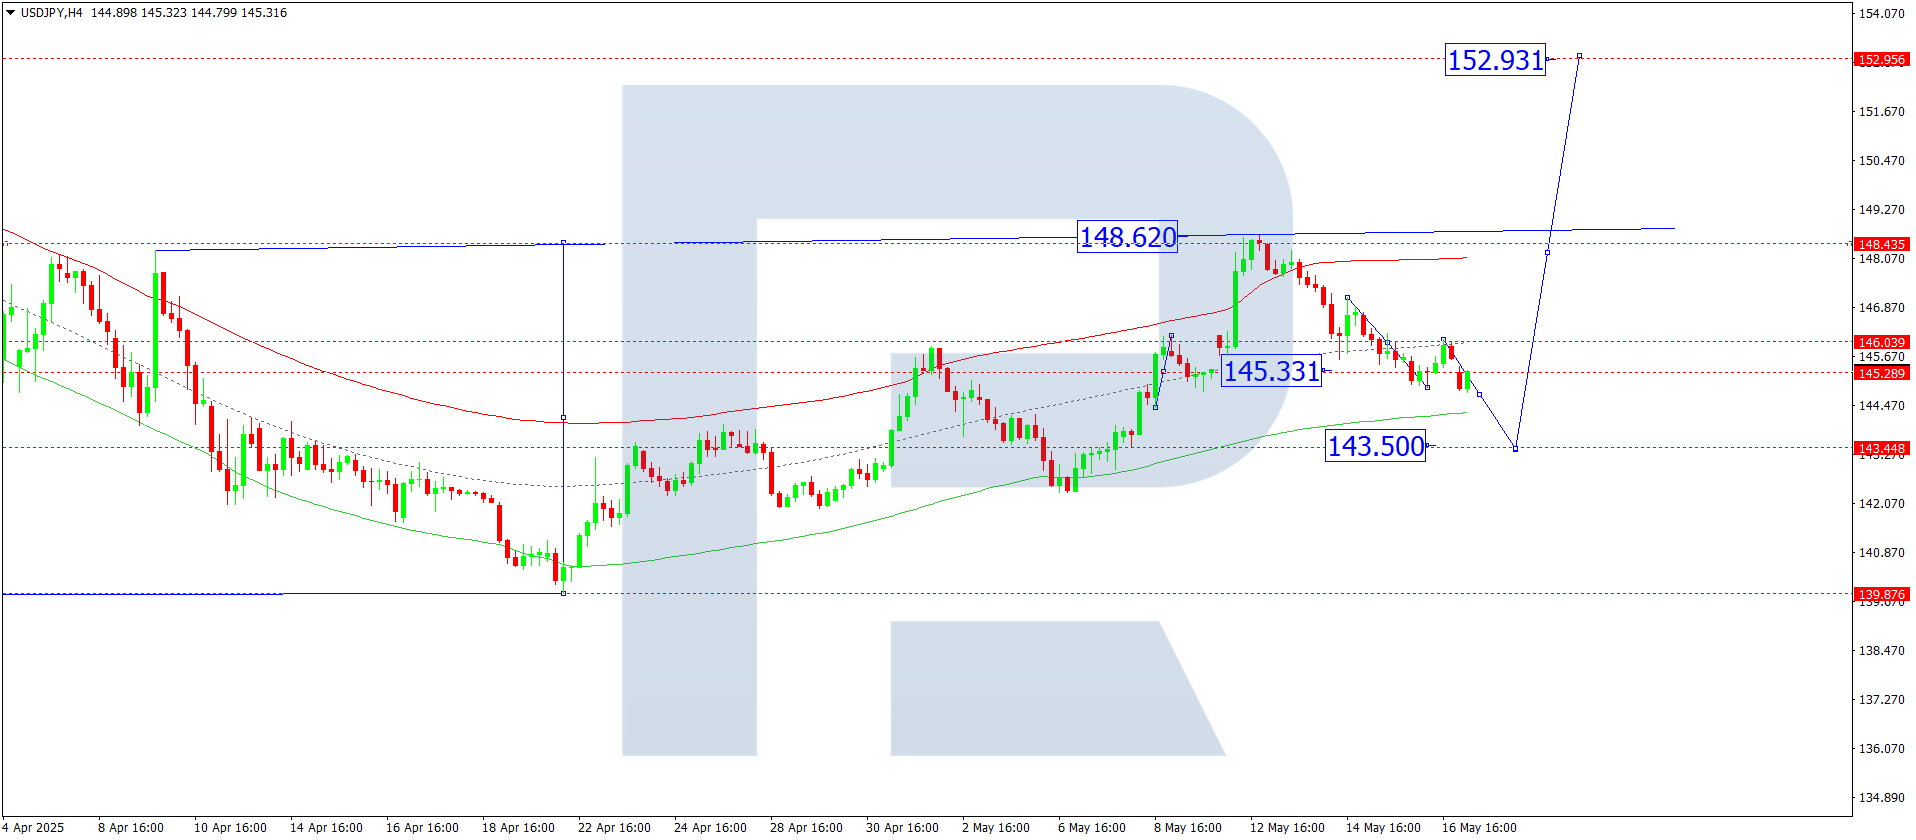
On the H4 chart of USDJPY, the market is consolidating around the 145.33 level. Today, 19 May 2025, a downward breakout may lead to a decline to 143.50. Afterwards, a new upward wave towards 148.44 could begin, with the trend potentially continuing to 152.93, the local target.
This scenario for USDJPY aligns with the Elliott wave structure and the upward wave matrix pivoting at 145.33, viewed as key in this wave. The market has completed the third upward wave to the upper boundary of the price Envelope at 148.64. A continued correction to the lower boundary at 143.50 remains possible before an upward wave resumes towards 148.44.
Technical indicators for today’s USDJPY forecast suggest a correction towards 143.50.
GBPUSD forecast
On the H4 chart of GBPUSD, the market continues to develop a consolidation range around 1.3260. Today, 19 May 2025, the range may expand to 1.3380. Afterwards, a new downward wave towards the first target of 1.3090 is expected.
This scenario is supported by the Elliott wave structure and the downward wave matrix with a pivot at 1.3260, seen as key in this wave. The market is currently consolidating around the central line of the price Envelope at 1.3260. A rise towards the upper boundary at 1.3380 is possible, followed by a decline to the lower boundary at 1.3090.
Technical indicators for today’s GBPUSD forecast view the upward movement as a correction towards 1.3380.

AUDUSD forecast
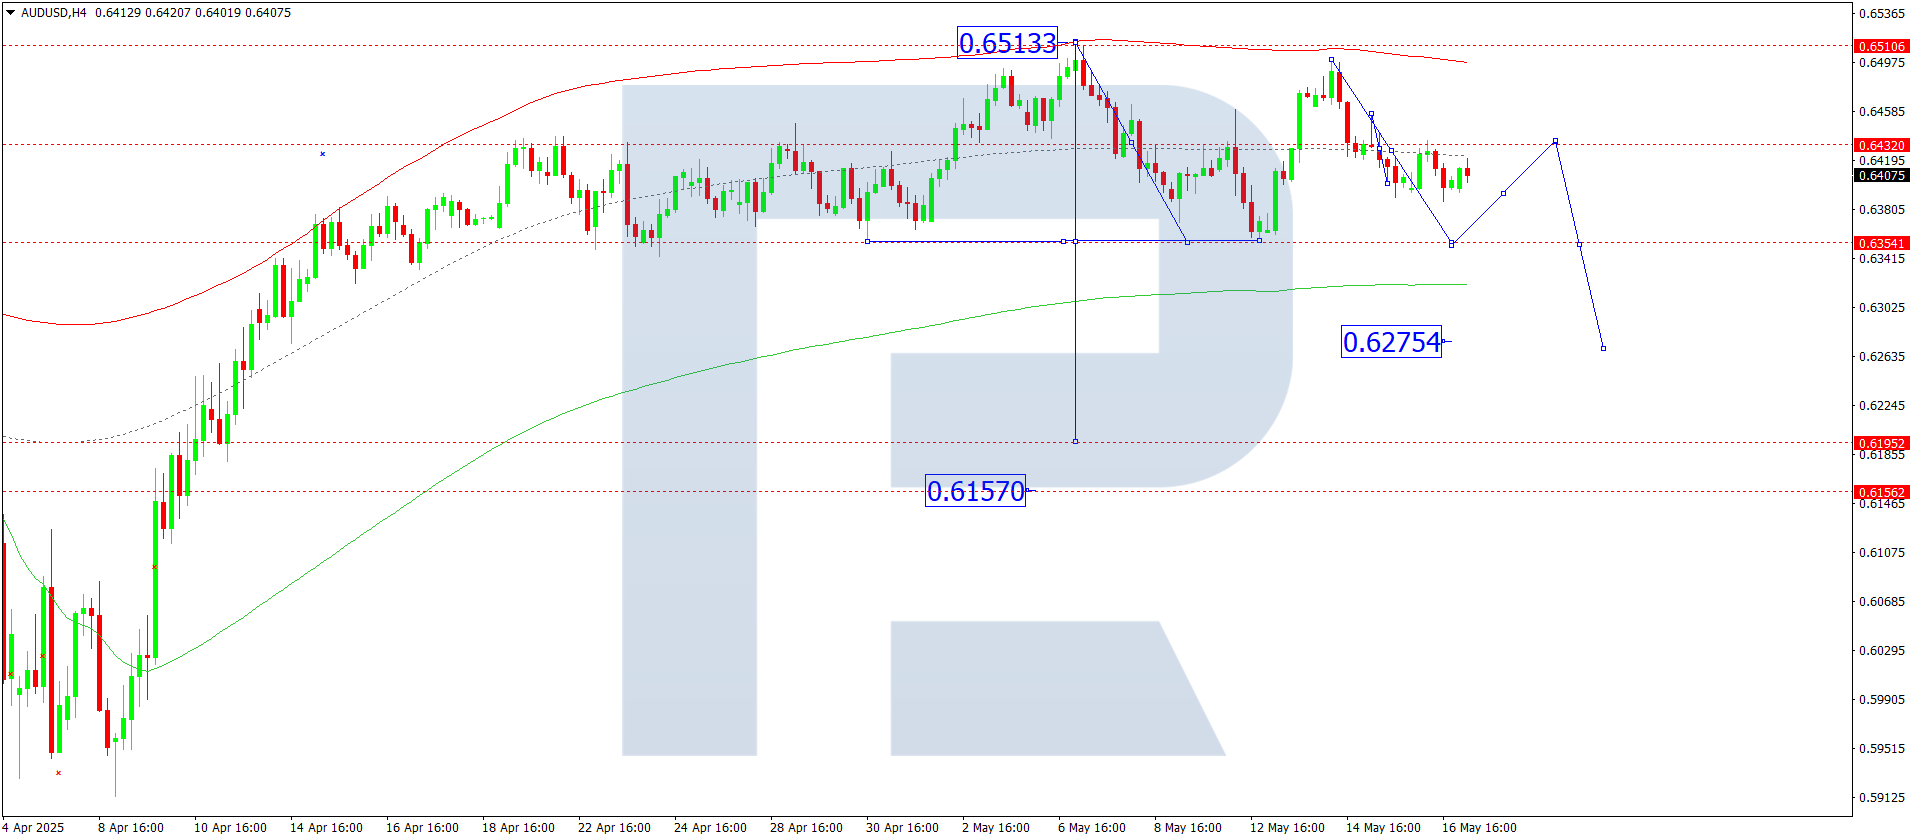
On the H4 chart of AUDUSD, the market is forming a wide consolidation range around 0.6432, with no clear trend. Today, 19 May 2025, a downward expansion to 0.6354 is possible. Then, the market may rebound to 0.6432 (tested from below). A break below the range would open potential for a continued downward wave to 0.6200, the first target.
This scenario is confirmed by the Elliott wave structure and the downward wave matrix for AUDUSD with a pivot at 0.6432, seen as key in the structure. Currently, a wave is forming to the lower boundary of the price Envelope at 0.6354. A correction to the central line at 0.6432 remains possible.
Technical indicators for today’s AUDUSD forecast suggest a downward wave towards 0.6355.
USDCAD forecast
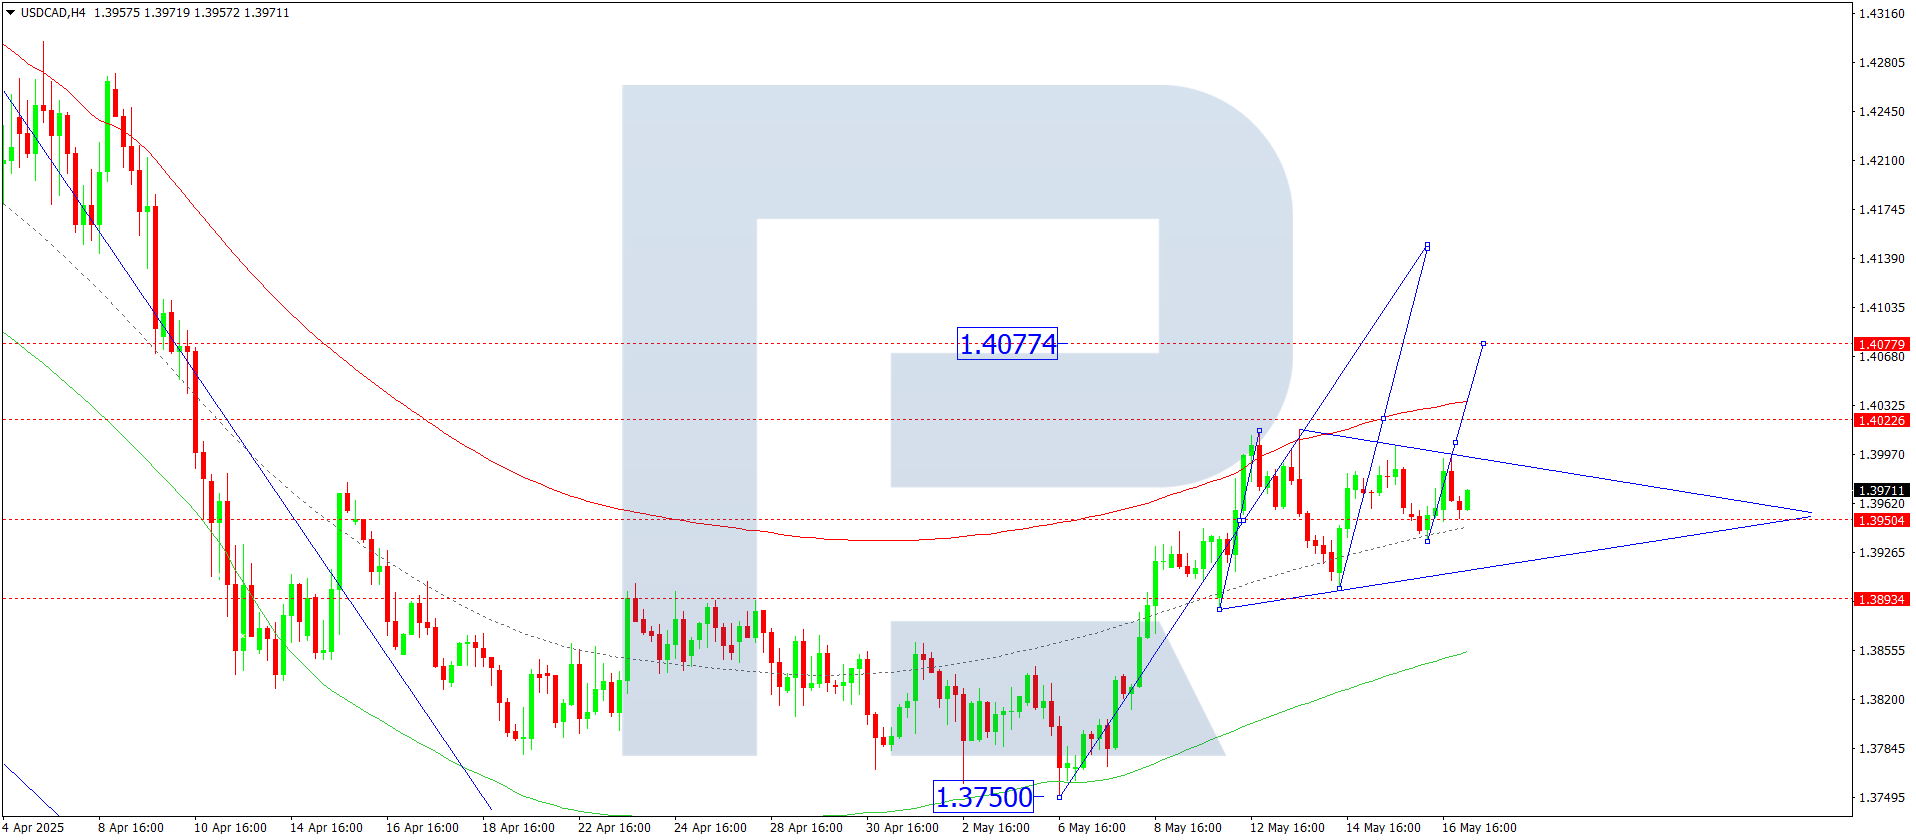
On the H4 chart of USDCAD, the market continues to form a consolidation range around 1.3950, with no clear trend. Today, 19 May 2025, a decline to 1.3894 is possible. Afterwards, a new upward wave may begin towards 1.4040, with the trend possibly continuing to 1.4140.
This scenario finds technical confirmation in the Elliott wave structure and the upward wave matrix with a pivot at 1.3950, considered key for USDCAD in this wave. The market previously reached the upper boundary of the price Envelope at 1.4012 and corrected to its central line at 1.3894. Following the completion of this correction, an upward wave to the upper boundary at 1.4040 becomes relevant.
Technical indicators for today’s USDCAD forecast suggest an upward wave towards 1.4040.
XAUUSD forecast
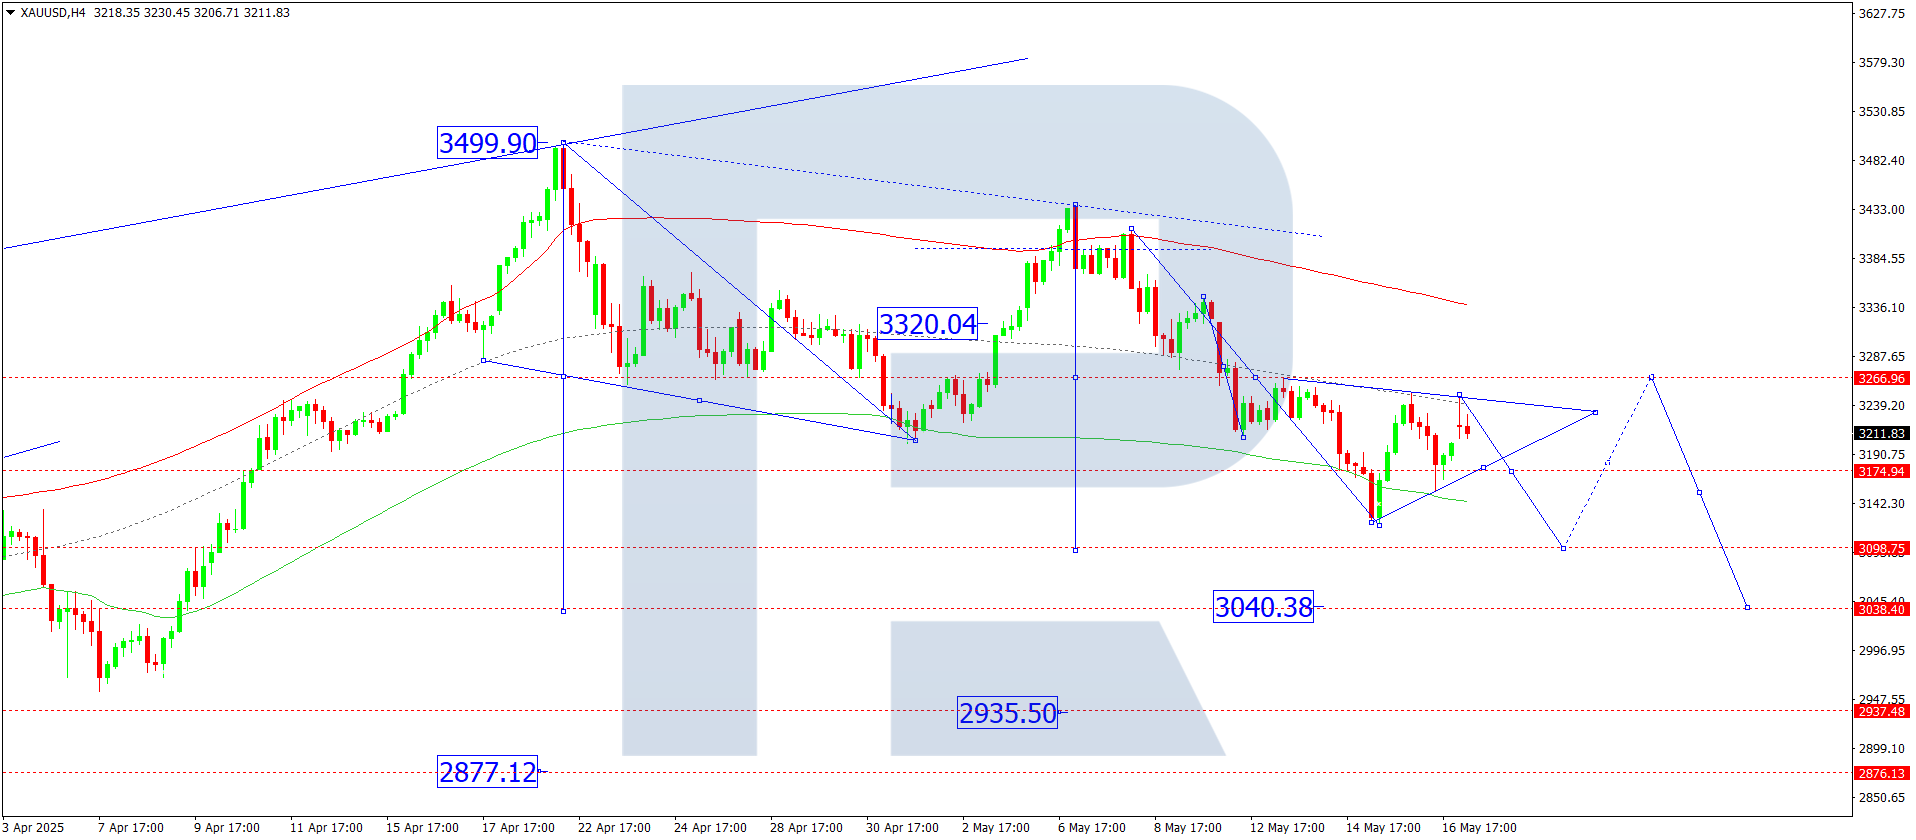
On the H4 chart of XAUUSD, the market continues to form a consolidation range around 3,266. Today, 19 May 2025, we expect a downward move to 3,100, with the trend potentially extending to 3,040, the first target.
This scenario aligns with the Elliott wave structure and the downward wave matrix pivoting at 3,266, which is seen as key in this wave for XAUUSD. Currently, the market is forming an upward structure towards the central line of the price Envelope at 3,266. Afterwards, a downward wave to the lower boundary at 3,100 is likely.
Technical indicators for today’s XAUUSD forecast suggest a possible decline to 3,100.
Brent forecast
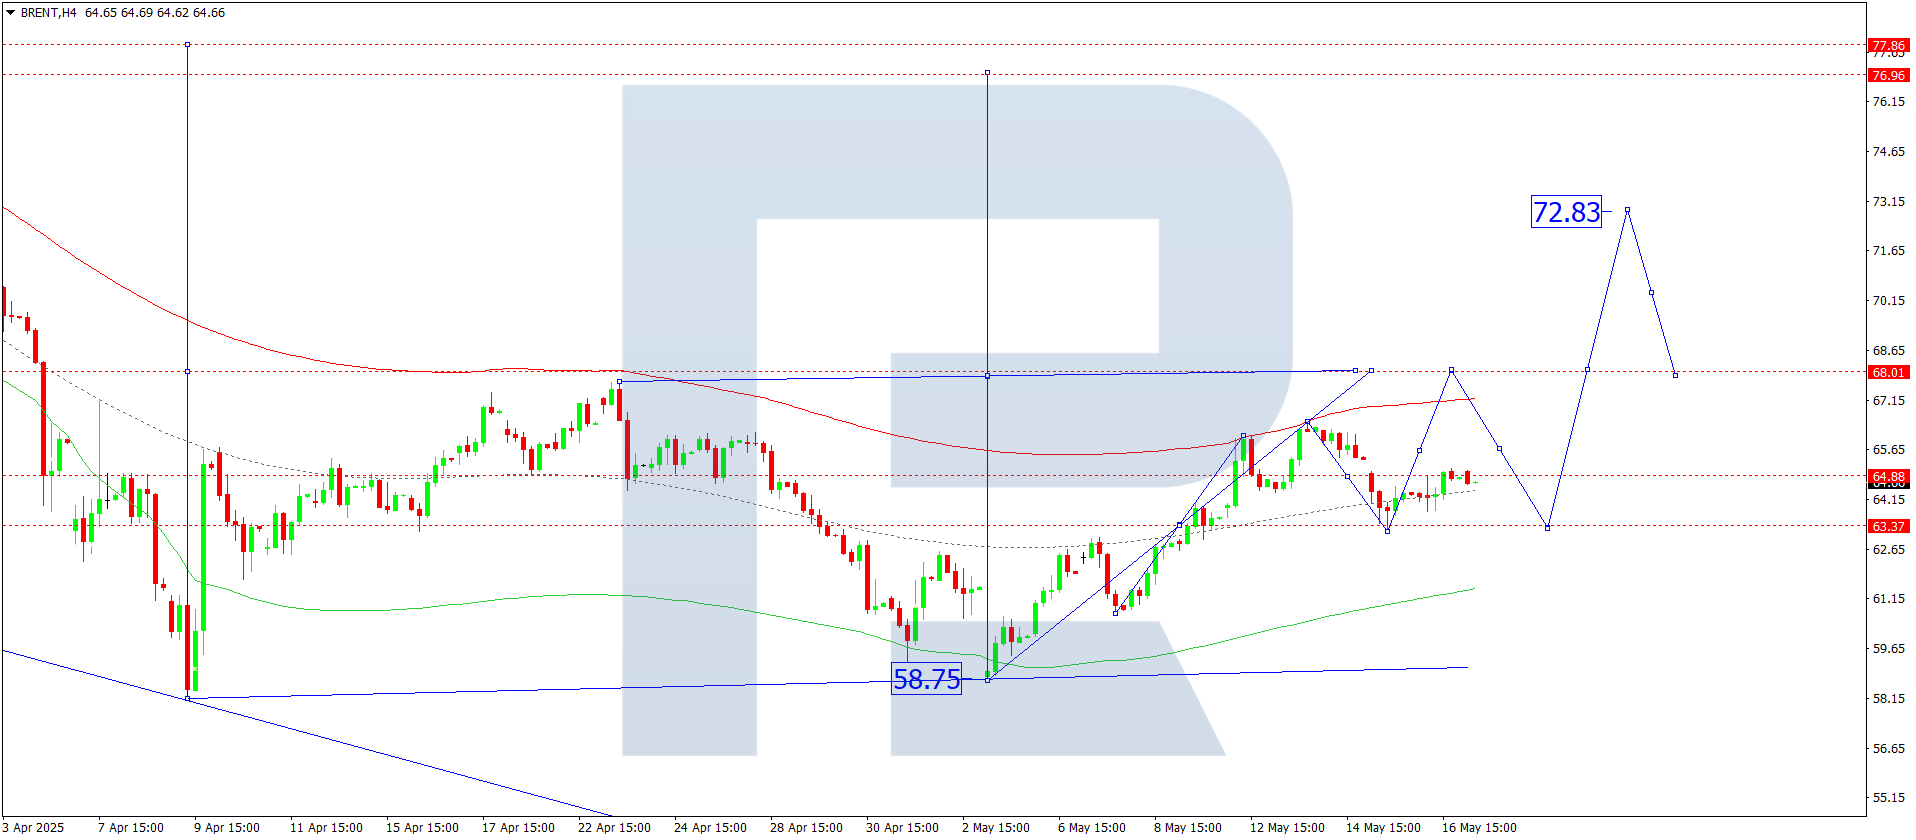
On the H4 chart of Brent crude, the market is forming a wide consolidation range around 63.33. Today, 19 May 2025, an expansion of the range to the upside towards 68.00 is possible. A breakout above this level would open the potential for a continued upward wave to 72.80, the local target.
This scenario is technically confirmed by the Elliott wave structure and the upward wave matrix with a pivot at 63.33, viewed as key for Brent in this wave. The market has previously completed a correction to the central line of the price Envelope at 63.33. An upward wave to the upper boundary at 68.00 remains relevant.
Technical indicators in today’s Brent forecast suggest a continued upward wave towards 68.00.
Forecasts presented in this section only reflect the author’s private opinion and should not be considered as guidance for trading. RoboForex bears no responsibility for trading results based on trading recommendations described in these analytical reviews.